Environmental Engineering Reference
In-Depth Information
Results and Discussion
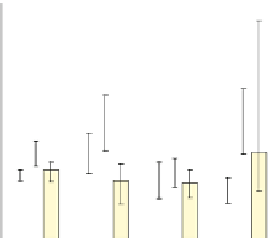
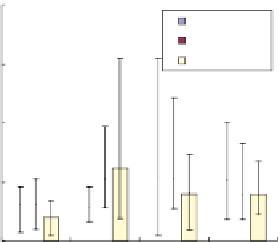
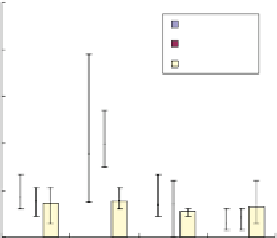
The runoff loads in the cities are summarized in Fig.
3
for each water quality con-
stituent. The error range lines show the maximum and minimum values of the col-
lected data. The mean unit loads for each land use are shown in Fig.
4
. They were
all calculated for the runoff and scrubbed values separately. Regardless of land use,
the mean SS unit load was about 4 kg/ha. The scrubbed load was 8-34 times larger
than the runoff load. The other water quality constituents also showed scrubbed
5
2
Residential
Commercial
Industrial
Residential
Commercial
Industrial
4
1.5
3
1
2
0.5
1
0
0
Chiba
Yokohama
Osaka
Kobe
Chiba
Yokohama
Osaka
Kobe
20
1.0
Residential
Commercial
Industrial
Residential
Commercial
Industrial
0.8
15
0.6
10
0.4
5
0.2
0
0.0
Chiba
Yokohama
Osaka
Kobe
Chiba
Yokohama
Osaka
Kobe
0.05
Residential
Commercial
Industrial
0.04
0.03
0.02
0.01
0.00
Chiba
Yokohama
Osaka
Kobe
Fig. 3
Runoff loads in each city