Environmental Engineering Reference
In-Depth Information
15
Scrubbed load
Runoff load
10
11.6
5
3.2
3.3
2.0
0.8
0.5
0.42
1.35
0.39
0.58
1.96
1.41
0
BOD
COD
BOD
COD
BOD
COD
Residential
Commercial
Industrial
150
1
Scrubbed load
Runoff load
Scrubbed load
Runoff load
0.8
100
0.6
0.66
139
0.4
0.23
50
0.25
0.2
74
0.11
0.19
0.06
0.22
0.03
0.14
35
0.03
0.01
0.
01
0
TN
TP
TN
TP
TN
TP
4.1
4.4
4.1
0
Residential
Commercial
Industrial
Residential
Commercial
ndustrial
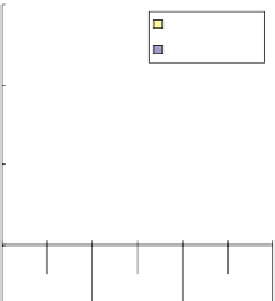
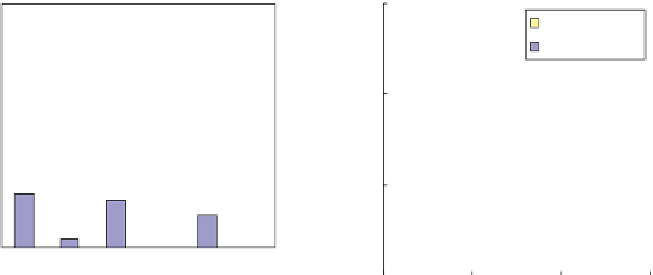
Fig. 4
Average unit loads (runoff and scrubbed loads)
loads larger than runoff loads. BOD, COD
Mn
, and SS showed a trend of values in
commercial district being larger than those in residential district, which were
almost equal to those in industrial district. The mean runoff loads and scrubbed load
shown in Fig.
2
were decided to be the load units obtained in this study.
Factors of Variation
A two-way layout analysis of variance was conducted on the collected 72 data sets
of runoff loads using the nearby land use state and the city as the two factors of
variation for each water quality constituent. The analysis showed that the factors
affected the runoff loads of COD
Mn
and TN at a level of significance of 5%. The
factors were statistically suggested to little affect the runoff loads of the other con-
stituents: BOD, SS and TP.