Database Reference
In-Depth Information
a
b
zmax
zmax
z
z
zmin
zmin
xmin
xmin
x
x
xmax
xmax
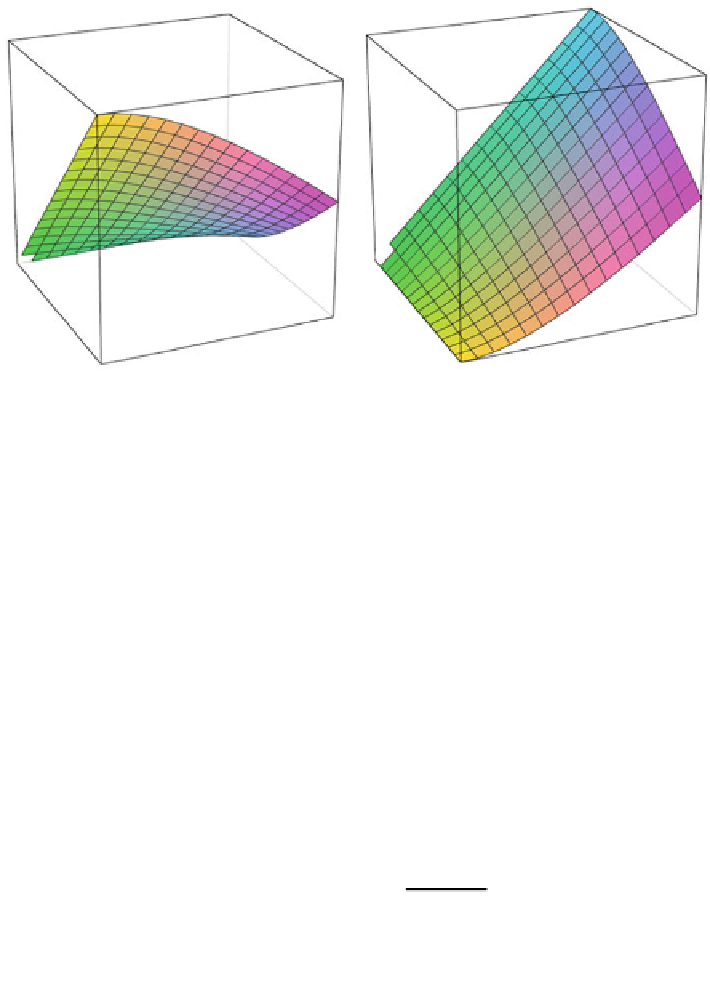
Fig. 4.4 Plot of the composite probabilities
p
1
and
p
2
as functions of the single probabilities
p
1
and
p
2
Both functions are illustrated in Fig.
4.4
, wherein
p
1
is to be found in (a) and
p
2
in (b).
Example 4.1
We stick to the case of two recommendations. Suppose that for a
single recommendation
a
1
that probability that a user accepts this recommendation
is 90 %, i.e.,
p
1
¼
0.9. Let further the acceptance probability of a second single
recommendation
a
2
be 40 %, i.e.,
p
2
¼
0.4.
Then, if both recommendations
a
1
and
a
2
are issued, the probability that the user
accepts this first recommendation
a
1
is
0
:
9
p
1
¼
0
:
91
0
ð
:
4
Þ
0
:
9
0
:
4
4
0
:
79
:
0
:
9
þ
0
:
Similarly, we obtain the probability that the user accepts the second recommen-
dation
a
2
as
0
:
4
p
2
¼
1
0
ð
:
9
Þ
0
:
4
þ
0
:
9
0
:
4
4
0
:
15
:
0
:
9
þ
0
:
Thus, these probabilities are lower than their single recommendation counter-
parts
p
1
and
p
2
, respectively. This is reasonable because of the obvious relation
p
1
þ p
2
1 (the user can accept at most one recommendation). We also see the
nonlinearity of the approach: while the ratio
of th
e initial probabilities was
p
1
/
p
2
¼
0.7/0.4
¼
2.25, it now has increased to
p
1
=
27.
For comparison, we also consider our linear approach. Since we do not know the
cross-product probabilities, we assume them to be zero, i.e.,
p
1
¼ p
2
¼
0. Then
(
4.3
) leads to
p
2
¼
0
:
79
=
0
:
15
¼
5
: