Agriculture Reference
In-Depth Information
Lithuanian Organic Agriculture in the Context of European Union
http://dx.doi.org/10.5772/58352
%
2010 2011 2012
20
18
16
14
12
10
8
6
4
2
0
EU-
28
EU-
27
BE
BG
CZ
DK
DE
EE
IE
EL
ES
FR
HR
IT
CY
LV
LT
LU
HU
MT
NL
AT
PL
PT
RO
SI
SK
FI
SE
UK
IS* NO** CH***
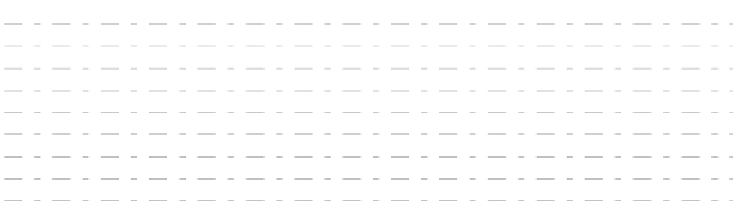
Note. *-data not available, **-2009, ***-2005; Source: Eurostat (Available from: <http://
epp.eurostat.ec.eu
r
opa.eu/tgm/table.do?tab=table&init=1&plugin=0&language=en&pcode=tsdpc440>)
Figure 6.
Share of total utilized agricultural area (UAA) occupied by organic farming (fully converted and under con‐
version) in per cent (%) 2010-2012.
Certified area, ha
Certified farm number, farms
3000
2805
2855
2668
2679
2598
150000
2511
2500
2348
157995
149096
125000
134955
162655
127362
1811
125457
2000
100000
102120
1500
1178
75000
69430
1000
50000
42955
500
25000
0
0
2004
2005
2006
2007
2008
2009
2010
2011
2012
Year
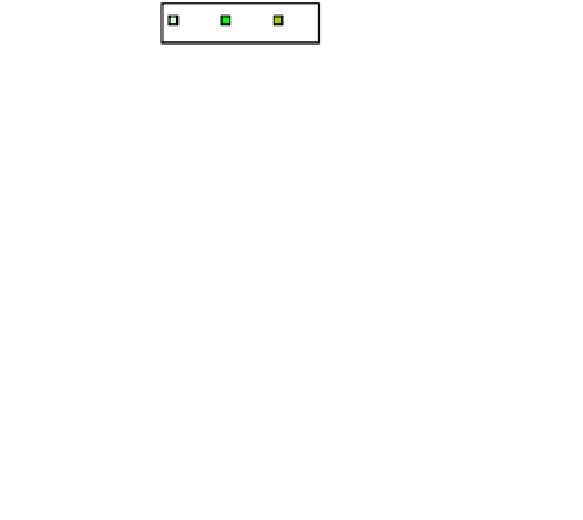
Figure 7.
Dynamics of certified organic agriculture farms number and area (fully converted and under conversion)
during 2004-2012 in Lithuania including area of fishery farms [18]; Source: Ekoagros.
70
60
64
50
60
55
50
40
30
20
10
0
2009
2010
2011
2012
Year
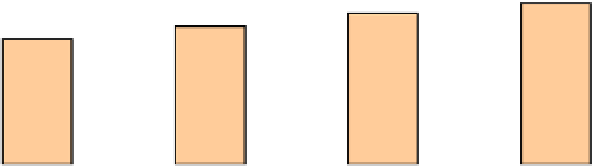
Figure 8.
Average size of certified organic farms in Lithuania, including area of fishery farms [18]; Source: Ekoagros