Agriculture Reference
In-Depth Information
1400
1169
1200
Certified farm number by the farm size in ha, farms
1000
800
600
422
409
410
400
200
51
13
0
0-30 ha
31-50 ha
51-100 ha
101-300 ha
301-500 ha
> 500 ha
Figure 9.
Differentiation of certified organic farms in Lithuania according to the farm size in hectares 2012 [18];
Source: Ekoagros.
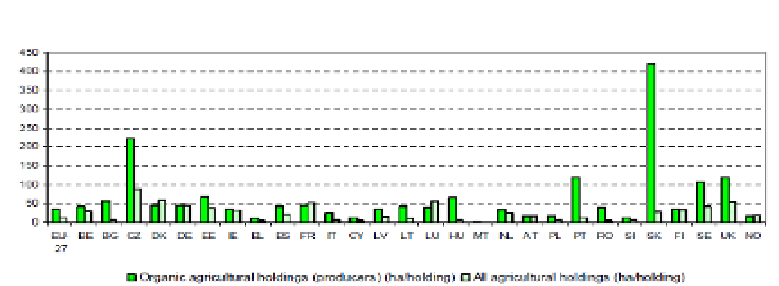
Note. Organic area: DK, MT data 2006; Organic holdings: MT data 2006; PL data 2008 [19];
Source: Eurostat (f
o
od_act2, food_in_porg1, ef_ov_kvaaesu)
Figure 10.
Average size of agricultural holdings/farms in European Union, 2007 (ha/holding)
4. Organic crop production
4.1. Dynamics of organic agriculture crop structure and distribution
The structure of agriculture in the Member States of the European Union varies as a function
of differences in geology, topography, climate and natural resources, as well as the diversity
of regional activities, infrastructure and social customs. There were 12.2 million farms across
the EU-28 in 2010, working 174.1 million hectares of land (the utilised agricultural area) or
two fifths (40.0 %) of the total land area of the EU-28 [20]. Farming land covers nearly 54%
of the total area of Lithuania, with arable land and grassland accounting for 70% and 27%
respectively.