Environmental Engineering Reference
In-Depth Information
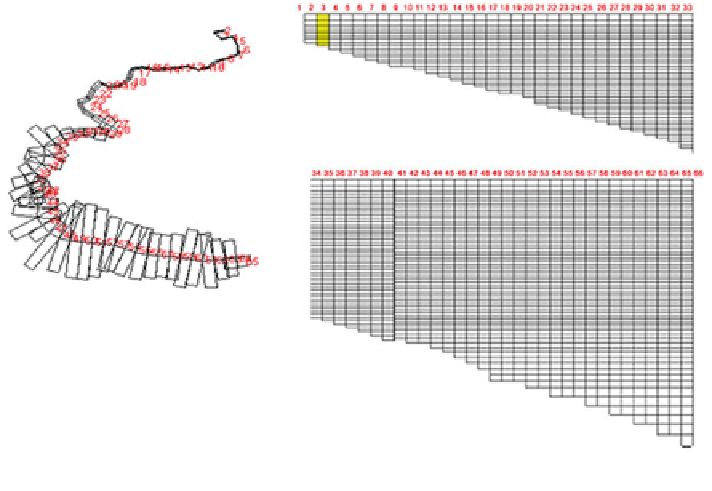
Fig. 6.3 Reservoir geometry simulation (Badrghasemi
2002
)
The maximum percentage of the difference between actual and model evaluated
volumes of the reservoir was about 0.5 % and the maximum percentage of the
difference between actual water levels and the model evaluation in the reservoir was
about 0.61 m. Figure
6.4
indicates a comparison between actual and model of water
level from May to December 2003.
After calibration of hydrodynamic characteristics of the reservoir, the water
quality of the reservoir was calibrated. Results of model sensitivity analysis are as
follows: Vertical distribution coef
cient AZ (man) had affected the model result
when analysis was carried out in a vertical direction. Increasing the mentioned
coef
cient in the model, lead to breaking thermo cline in depth and also surface
absorption radiation coef
cient in depth affected the construction of the model and
the use of a bigger coef
cient led to a simulation result closer to reality.
cant effect in the reduction of solar
radiation and correction of it caused an improvement in the result. The wind
velocity correction was an important parameter for model calibration.
Figures
6.5
,
6.6
,
6.7
and
6.8
describe the comparison between results of simu-
lation of temperature and TDS pro
Cloud cover coef
cient also had a signi
les with experimental work which was carried
out from May to December 2003.
As presented in Fig.
6.5
in late June and early July 2003, water temperature and
TDS on the top of the water level were about 32
C and 370 mg/l respectively; and
in the bottom of the reservoir temperature and TDS was 14
°
°
C and 680 TDS mg/l
respectively. According to the results, there was strati
cation, also the inlet water to
the reservoir had a water temperature about 20
°
C and TDS 690 mg/l.
Search WWH ::

Custom Search