Environmental Engineering Reference
In-Depth Information
In practice, if
P
< 0, 1, it is recommended to find another distribution
law.
In general, using the criterion of goodness of fit, it is possible to refute
the selected hypothesis, and if
P
is large enough, then it cannot serve as
proof of the correctness of the hypothesis, but merely indicates that the
hypothesis does not contradict the experimental data.
1.2.5 The normal distribution law
The normal distribution, or Gaussian distribution, is the most versatile,
convenient and widely used.
It is assumed that the operating time is subject to the normal distribution
(normally distributed), if the density distribution of failures is given by:
1
(
ta
−
)
ft
( )
=
exp
,
−
[1.42]
2
2
b
d
1
π
where
a
and
b
are the parameters of the distribution, respectively,
mathematical expectation and standard deviation which are expressed on
the basis of the test results as follows:
ˆ
ˆ
2
aTb D
≈
;
≈
,
0
ˆˆ
where
TD
are the estimates of mean operating time and variance.
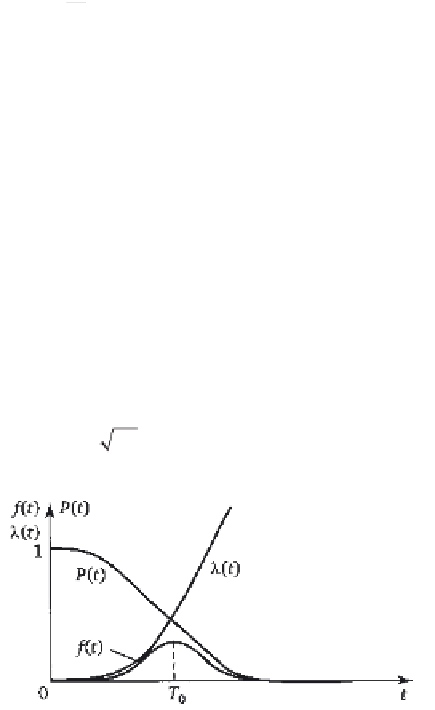
The graph of the reliability indices for the normal distribution is shown
in Fig. 1.14.
The meaning of the parameters
T
0
and
S
of the normal distribution will
be clarified. The graph
f
(
t
) shows that
T
0
is the centre of symmetry of the
distribution, since the sign of the difference (
t -T
0
) does not change the
expression. At
t
= T
0
the p.d.f.
reaches its maximum
0
1
ft
()
=
.
max|
S
2
π
t
−
T
0
1. 14
Graphs of changes in the reliability indices for the normal
distribution.


Search WWH ::

Custom Search