Database Reference
In-Depth Information
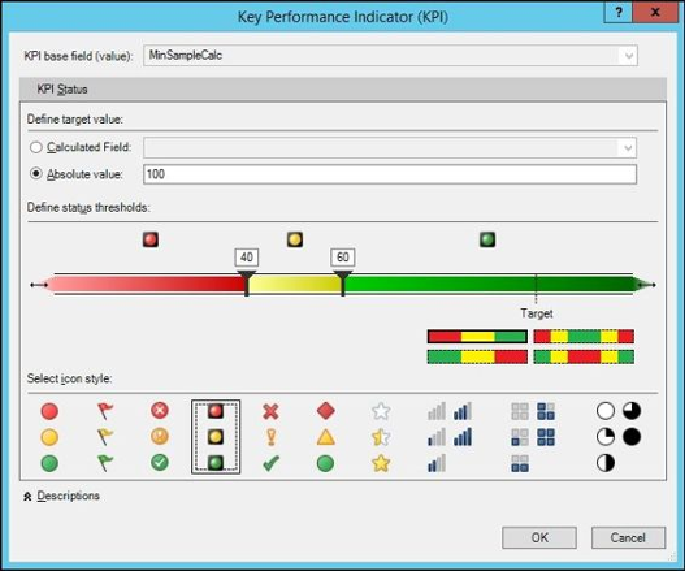
13. Click on
OK
to save the KPI definition.
14. Click on the
Pivot Table
icon and select
Pivot Table
. Then click on
OK
.
Visualization with PowerPivot
Next, this recipe describes the steps to create KPIs and visualize the data in
Pivot Table
:
1. The previous recipe ended with the creation of a Pivot Table; this opens the inter-
face to configure your chart.
2. Under
PivotTable Fields
, expand
PerformanceDataAllView
and drag
NewColumn.Path
onto
FILTERS
.
3. Drag
Day
onto
ROWS
.