Environmental Engineering Reference
In-Depth Information
and 18th, although the Great Basin High was still there, another cold system started
moving into Washington, Oregon and northern California. The observed large
AOD values were mostly in the southern portion of the Central Valley, in the
areas between Fresno and Bakersfield.
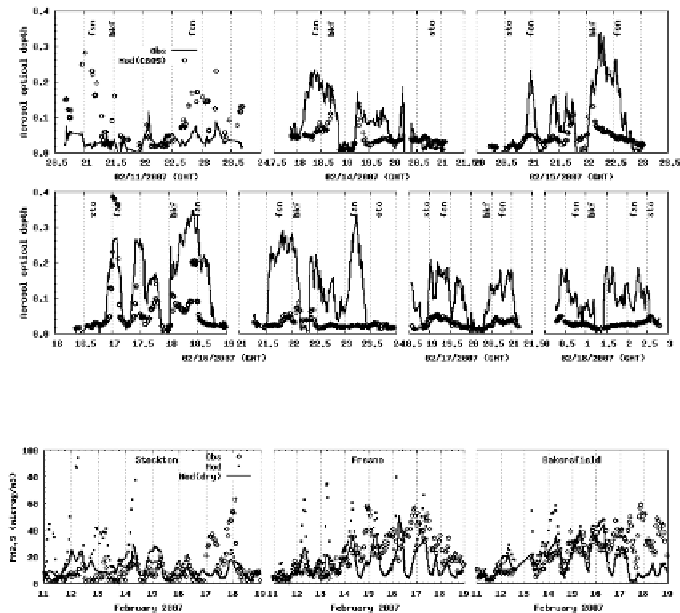
The modeled AOD values from CMAQ with CB05 and SAPRC99 show few
differences between them. With the exception of February 11 and a couple of
points on February 16, the modeled AOD values were smaller than the observed
ones. The modeled peak values usually corresponded well to the observed peaks
near Fresno and Bakersfield. Some of the peak values were very close to the observed
ones. However, the modeled peaks were sharper than the measured peaks. This
may be due to the unrealistically abrupt change of emissions from one model grid
cell to another in the urban areas near Fresno and Bakersfield. The modeled
meteorological fields on these days were fairly good.
The surface observed PM2.5 (
Fig. 3)
in the valley has a similar trend of the
HSRL AOD until February 17, 2007. The concentrations gradually ramped up from
the 11th to the 15th and 16th, especially at the sites in southern San Joaquin Valley.
With the exception of Fresno, after the 16th, the observed PM2.5 at other sites in
southern San Joaquin Valley stayed at the high level of the 16th. Sacramento,
Fig. 2.
Comparison of HSRL observed AOD and modeled AOD. Stockton (sto), Fresno (fsn),
Bakersfield (bkf) are marked to show the values close to these sites
Fig. 3.
Comparison of hourly BAM PM2.5 and CMAQ/CB05 modeled PM2.5 at three sites in
the Central Valley. The modeled dry PM2.5 does not include water contents (Time in PST)