Environmental Engineering Reference
In-Depth Information
to 100 mb level. The lowest half sigma level was about 15 m above the ground.
The 12 km domain MM5 output was used as the input to the CMAQ system.
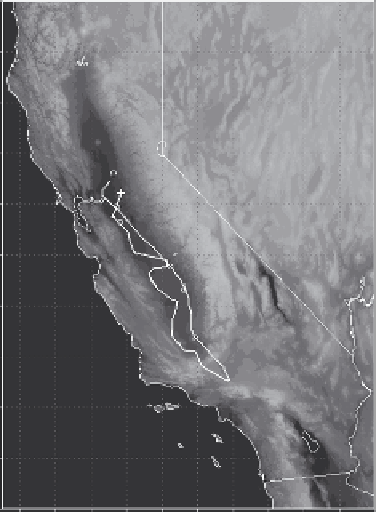
Between February 11 and February 18, 2007, NASA King Air flew seven times
in the Central Valley. The flight paths
(Fig. 1)
are along the city corridor and/or
highways I-5 and US-99. The paths are very similar between flights. This ensures
AOD measurements capture day to day variations. Surface PM2.5 and meteoro-
logical observations at sites located in cities such as Sacramento, Stockton,
Fresno, and Bakersfield (
Fig. 1)
were available for our model evaluation.
We used an empirical approach to calculate modeled AOD from CMAQ modeled
PM concentrations. To consider effects of hygroscopic particles, the humidity
adjustment factors used in the Regional Haze Guideline Documents were applied
to sulfate, nitrate, ammonium, and sea salt derived PM mass (Malm et al., 1994).
42N
41N
40N
39N
Sacramento
38N
Stockton
Modesto
37N
Fresno
Visalia
36N
Bakersfield
35N
34N
33N
32N
124W 123W 122W 121W 120W 119W 118W 117W 116W 115W 114W
Fig. 1.
Path of the NASA King Air flight on February 11, 2007 in the Central Valley. The paths
of the other flights are similar
The observed AOD (
Fig. 2)
shows that the aerosol loadings in the atmosphere
gradually built up from February 11 to February 16. The maximal observed AOD
value was about 0.1 on February 11. It reached about 0.35 on February 15 and
February 16. On the 17th and 18th, the values reduced to about 0.2. Two dis-
tinctive weather systems occurred in the region during this period. From the 11th
to 13th, the Central Valley experienced a cold front passage and the control of the
low pressure behind it. Starting from the 14th, a high pressure system gradually
moved in and up to the 16th, a typical Great Basin High established. On the 17th