Environmental Engineering Reference
In-Depth Information
4-20 ppb predominantly show net ozone production, with 20-60 ppb, predominantly
net ozone destruction, and with more than 60 ppb, always net ozone destruction.
All grid cells with VOC concentrations 25-50 ppbc show only net ozone pro-
duction. Note that the minimum VOC concentration in the SFBA was 25 ppbc.
Grid cells with VOC concentrations of 50-110 ppbc predominantly show net
ozone production, with 110-190 ppbc, predominantly net ozone destruction and
with more than 190 ppbc, only net ozone destruction.
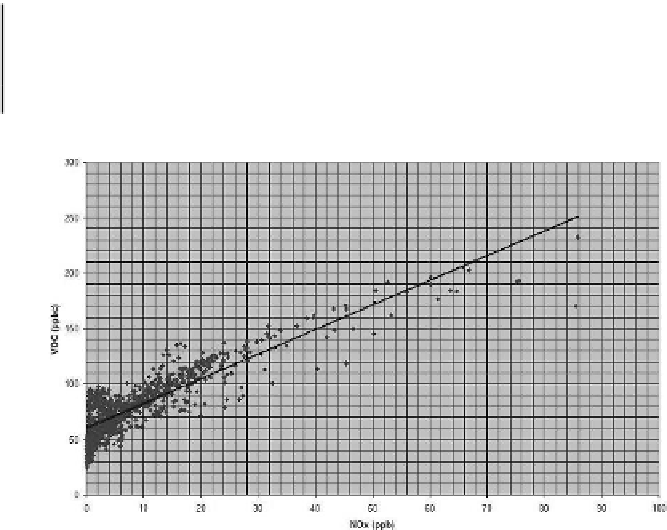
Figure 3
, a scatter plot of VOC and NOx, shows a regression line for VOC and
NOx concentrations. Cells with high VOC and NOx concentrations (near large
anthropogenic emission sources) are generally low V/N ratio areas with net ozone
destruction. Cells with low VOC and NOx concentrations are high V/N ratio areas
with net ozone production.
The horizontal distribution of the V/N ratio in the SFBA is shown in
Fig. 4
(left
panel). In the San Francisco Bay and areas in the east and south of the Bay, the
V/N ratio is less than 6. This is the region where net ozone destruction dominates.
There is a large area in the east and a narrow strip of land in the west of this region
where the V/N ratio is between 6 and 12. While in the east, net ozone production
dominates, net ozone destruction dominates in the west because of cold air tempe-
rature,
Fig. 4 (
right panel).
Table 1.
The relationship between change in ozone and in NOx and VOC concentrations
VOC (ppbc)
25-50
50-110
111-190
190<
Change
in ozone
Production
only
Production
dominant
Destruction
dominant
Destruction
only
NOx (ppb)
0-4
4-20
20-60
60<
Fig. 3.
Scatter plot of NOx and VOC with regression line