Environmental Engineering Reference
In-Depth Information
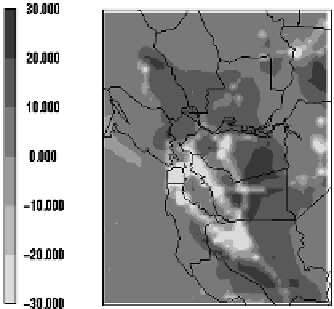
Fig. 1.
Simulated 1-h ozone concentrations (ppb, left panel) and 1-h net change in ozone
concentrations due to chemical processes (ppb/h, right panel) at 1400 PDT on July 31, 2000
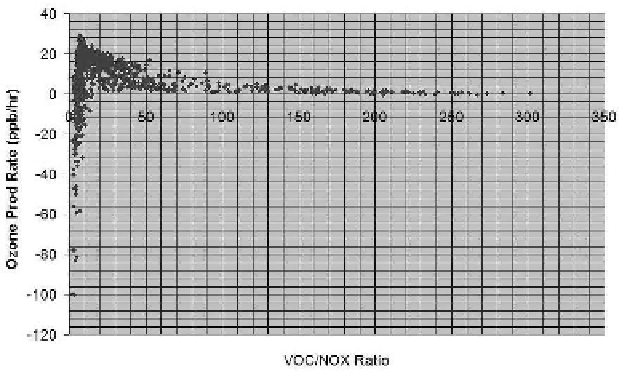
Fig. 2.
Scatter plot of ozone production rate versus V/N ratio
The locations of maximum ozone and net ozone production areas mostly
matched, as expected.
The relationship between ozone production rate and the V/N ratio is shown in
Fig. 2.
Each point in the figure shows information from a grid cell in the SFBA
domain. Ozone production was at a maximum when the V/N ratio was about 7.
Ozone production decreased gradually with increasing V/N ratio. In the areas
where the V/N ratio was less than 7, the rate of ozone production decreased sharply.
These are in general NOx rich areas with a large titration rate of ozone.
The relationship between change in ozone concentration and NOx and VOC
concentrations are shown in
Table 1.
All grid cells with NOx concentrations of
0-4 ppb show net ozone production. Ozone production at these cells increases
linearly with increasing NOx concentration. Cells with NOx concentrations of