Environmental Engineering Reference
In-Depth Information
The model simulations for the three selected explosions have shown that the
radioactive clouds of particles emitted during these explosions were located
outside the Norwegian territory on 20 October 1958. However, the radioactive
cloud from the second explosion (15.10.1958) passed the Northern Norway on the
way to its final destination on 20 October. The model simulations once again
confirmed that the direct transport from Novaya Zemlya to Bergen was not
responsible for the high level of activity measured in Bergen on 20 October 1958.
As meteorological input for the model runs has been generated by running the
high resolution limited area model HIRLAM version 7.1.3. (Unden et al., 2002).
HIRLAM has been running on ERA40 data (Uppala et al., 2005), using a blending
method (Yang, 2005).
2. Model Simulation of Stratospheric Intrusion
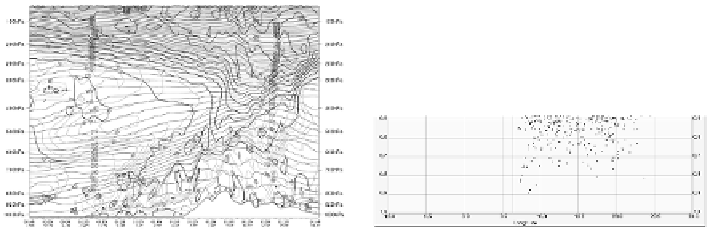
The SNAP model was also applied to simulate the stratospheric intrusion of
radioactive particles for the episode of high measured activity on 20 October 1958,
in the Norwegian territory close to Bergen. The case of stratospheric intrusion
was strongly indicated by the analysis of potential vorticity shown in
Fig. 2a.
(Saltbones et al., 2007).
In order to simulate this affect with the SNAP model we placed a large cloud of
the model particles in the stratosphere, in the range 1,000-2,000 km upwind from
Bergen, as an initial condition for the model run. The results of the model
simulation are shown in
Fig. 2b
in the form vertical cross-section with the model
particle locations. They confirmed the earlier findings about the effect of strato-
spheric intrusion as the major mechanism leading to high level of radioactivity
measured on 20 October 1958 in Bergen.
a)
b)
Fig. 2. (
a) Vertical cross-section near Bergen showing potential vorticity, potential temperature
and relative humidity for 20 October 12 UTC. (b) Vertical locations of model particles for the
same cross-section as (a)