Biomedical Engineering Reference
In-Depth Information
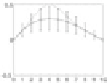
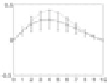
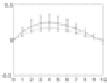
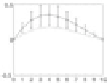
Figure 13.
Average subendocardial radial strain plots across 112 NURBS model variants
showing the mean (solid line) and standard deviation (error bars) for the predicted strain
values for the six basal (top row) and six mid-cavity (bottom row) regions. The dashed line
represents the ground truth strain value predicted by the analytical model.
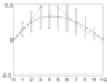
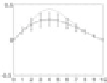
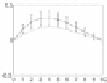
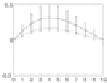
Figure 14.
Average subepicardial radial strain plots across 112 NURBS model variants
showing the mean (solid line) and standard deiation (error bars) for the predicted strain
values for the six basal (top row) and six mid-cavity (bottom row) regions. The dashed line
represents the ground truth strain value predicted by the analytical model.
nomenon to the amount of data available for fitting in each of the three parametric
directions. In the radial direction there is a paucity of tag line data compared with
the circumferential direction. The variability in longitudinal strains for a number
of regions is due to the motion dictated by the large
k
1
parameter values used for
this deformation, which provided the requisite circumferential strains but gener-
ated slightly abnormal radially dependent deformation in the long-axis images.
Increasing the number of tag lines within the myocardium is likely to increase the
strain accuracy in all three directions.
After finding the tags and contours for the three dog studies, we apply the
Cartesian-based cylindrical parameterized NURBS model described in the pre-
vious section and calculate the strain values for each dog. After registering all
models to
t
=0, the resulting registered 3D volumetric NURBS models at each
time point were then temporally lofted (order = 4 with 6 temporal control points)
to formulate a single 4D NURBS model for each dog study. This allows us to nor-
malize all dogs in terms of the temporal length of the cardiac cycle. The normal
systolic strains were then averaged over the twelve regions described earlier. These
values were averaged across all three dog studies and plotted in Figures 20 and 21.