Information Technology Reference
In-Depth Information
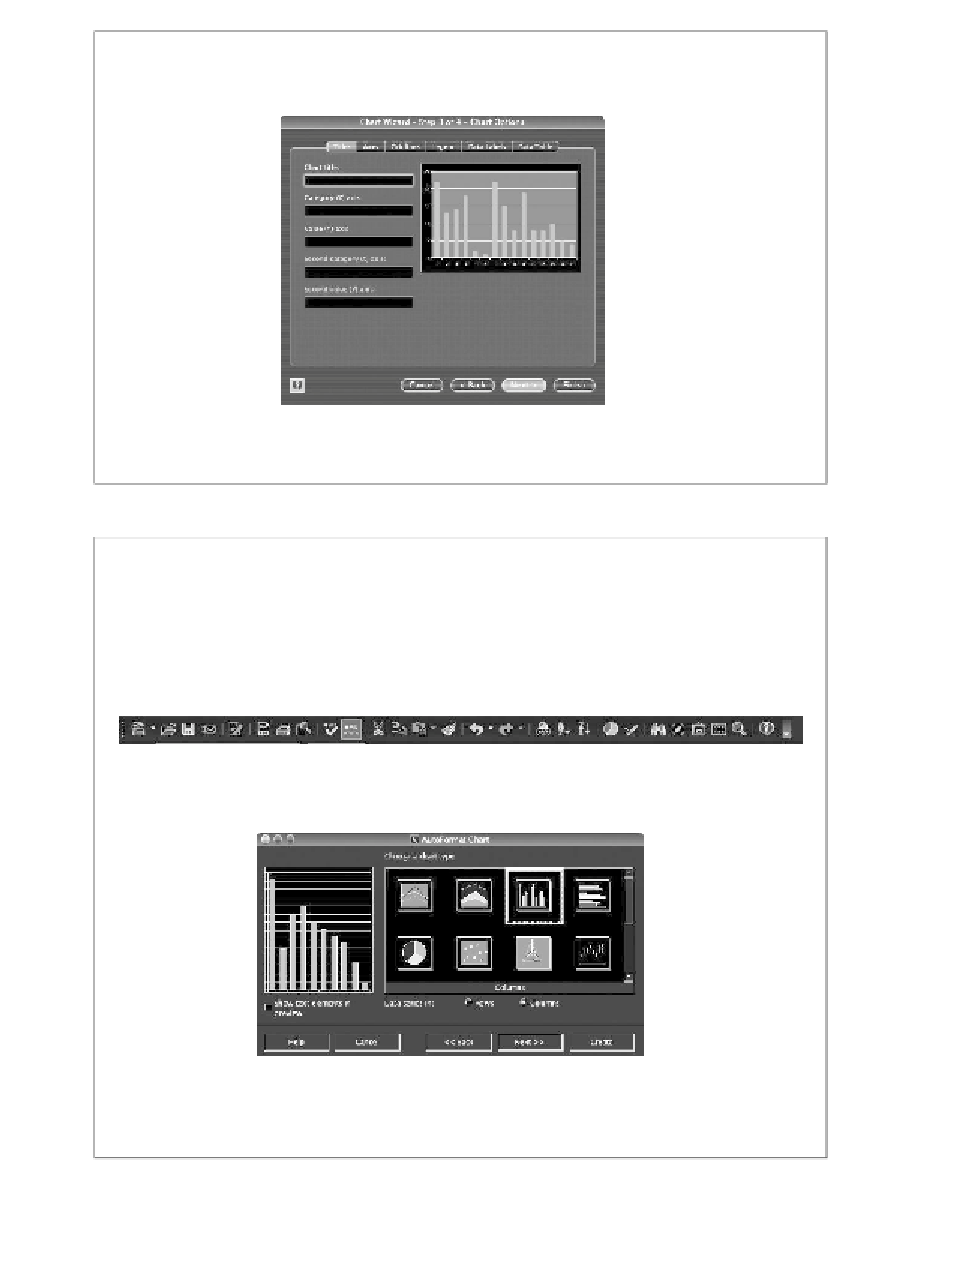
In most cases, you select bar chart (histogram), line plot or scatter plot.
Continuing with the wizard, you can specify the plot title and axis labels.
And finally, you can choose whether to place the resulting chart in the cur-
rent worksheet, or create a new worksheet.
Example
Creating a chart with OpenOffice Calc
OpenOffice Calc
is very similar to
Excel
. Enter data in rows and columns,
select one or more rows and columns, and click on Insert Chart, then click
the worksheet again (this step is different from Excel).
The chart wizard will open, and take you through some steps. Select the
chart type:
Select the labels:
(Continued)