Information Technology Reference
In-Depth Information
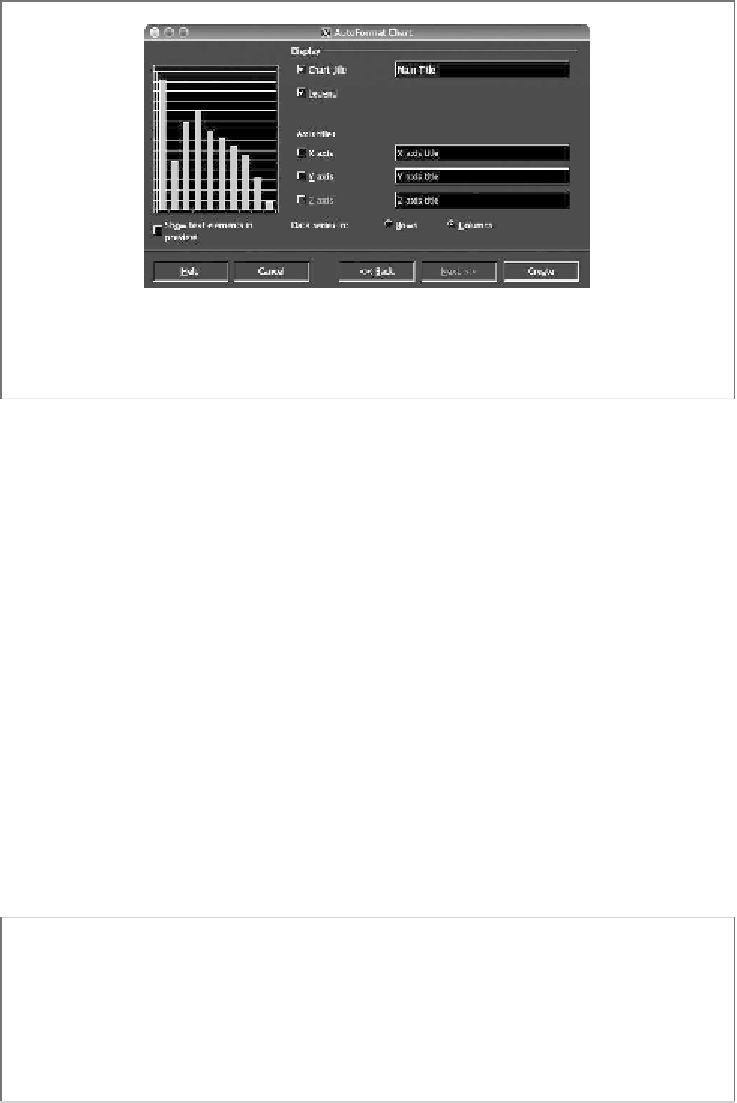
And save the chart. By default it will go into the current worksheet. The
chart can be selected again later, and moved or modified. These charts can
later be imported by other applications.
Spreadsheet software was covered first because, in some form, it is commonly
available on desktop computers. In addition, spreadsheets are mostly quite
easy to use. However, the appearance of charts is not under the control of the
user to any great extent. Sometimes it is worthwhile to use other, more com-
plicated, software packages such as
Matlab
(Mathworks),
IDL
(RSI),
Maple
(MapleSoft),
Canvas
(Deneba) or
Origin
(OriginLabs). These each include a
command language that allows flexible control of the exact appearance of
plots. With some effort, it is possible to create visually beautiful charts of data.
Additionally, they also have sophisticated analysis tools built in. These appli-
cations are probably too expensive for home users, but one or more of them is
frequently available at institutions. They are overkill for many data analysis
projects, but for the remainder they are completely necessary.
One more example of a simple charting program is
gnuplot
, available free for
Unix/Linux, Mac OS X, and Windows with Cygwin. It can be run interactively
or from command files, and creates somewhat rudimentary plots, but is able to
output in several different file formats or directly to the computer display.
Example
Creating a chart with gnuplot
Data file (indata):
10.0 3.0
11.0 4.0