Environmental Engineering Reference
In-Depth Information
0
20
40
60
80
100
120
140
160
180
200
200
180
160
140
120
100
80
60
40
20
0
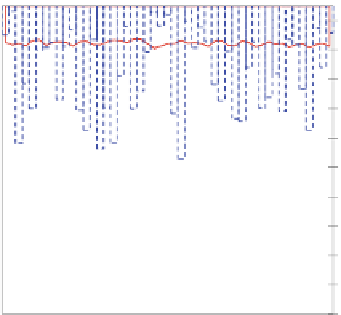
Temperature
Precipitation
Discharge
Fig. 4.14
Comparison between precipitation, temperature, and discharge in June (Between 1961
and 2009)
0
20
40
60
80
100
120
140
160
180
200
200
180
160
140
120
100
80
60
40
20
0
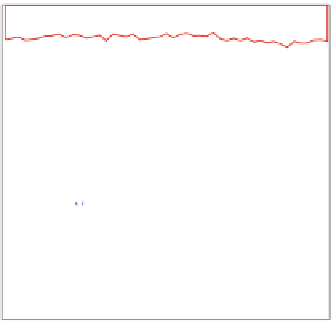
Temperature
Precipitation
Discharge
Fig. 4.15
Comparison between precipitation, temperature, and discharge in July (Between 1961
and 2009)
• Maximum discharge in 2008 was more than 1977.
According to these results, the proposed question is ''why despite the abundant
rainfall in 1977, the amount of discharge was less than 2008?'' It is assumed that
the land use change and melting of snow as triggering factors are an acceptable


Search WWH ::

Custom Search