Environmental Engineering Reference
In-Depth Information
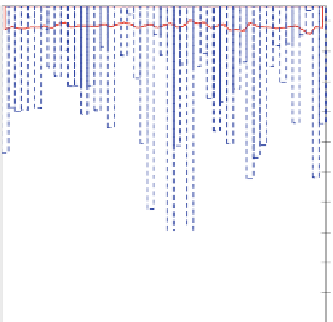
Fig. 4.12 Comparison
between precipitation,
temperature, and discharge in
April (Between 1961 and
2009)
0
20
40
60
80
100
120
140
160
180
200
200
180
160
140
120
100
80
60
40
20
0
Temperature
Precipitation
Discharge
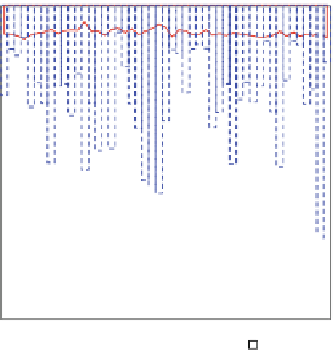
Fig. 4.13 Comparison
between precipitation,
temperature, and discharge in
May (Between 1961 and
2009)
0
20
40
60
80
100
120
140
160
180
200
200
180
160
140
120
100
80
60
40
20
0
Temperature
Precipitation
Discharge
was 22.9 C. To better compare the three variables plotted as Figs.
4.12
,
4.13
,
4.14
, and
4.15
.
The results of time series analysis between 1961 and 2009 show that the highest
precipitation was in 1977. Therefore, this year was selected to compare with 2008
(the year of recent flood occurrence). The results of the analysis for monthly data
of precipitation, discharge, and temperature are shown in Table
4.2
and Fig.
4.16
.
The following results were determined from Fig.
4.16
a, b and Table
4.2
:
• The precipitation for almost all the months in 1977 was more than 2008.
Generally speaking, precipitation decreases at the end of the period (1961-209).
• The temperature for almost all the months in 2008 represented an increasing
amount to maximum 4 C.


Search WWH ::

Custom Search