Database Reference
In-Depth Information
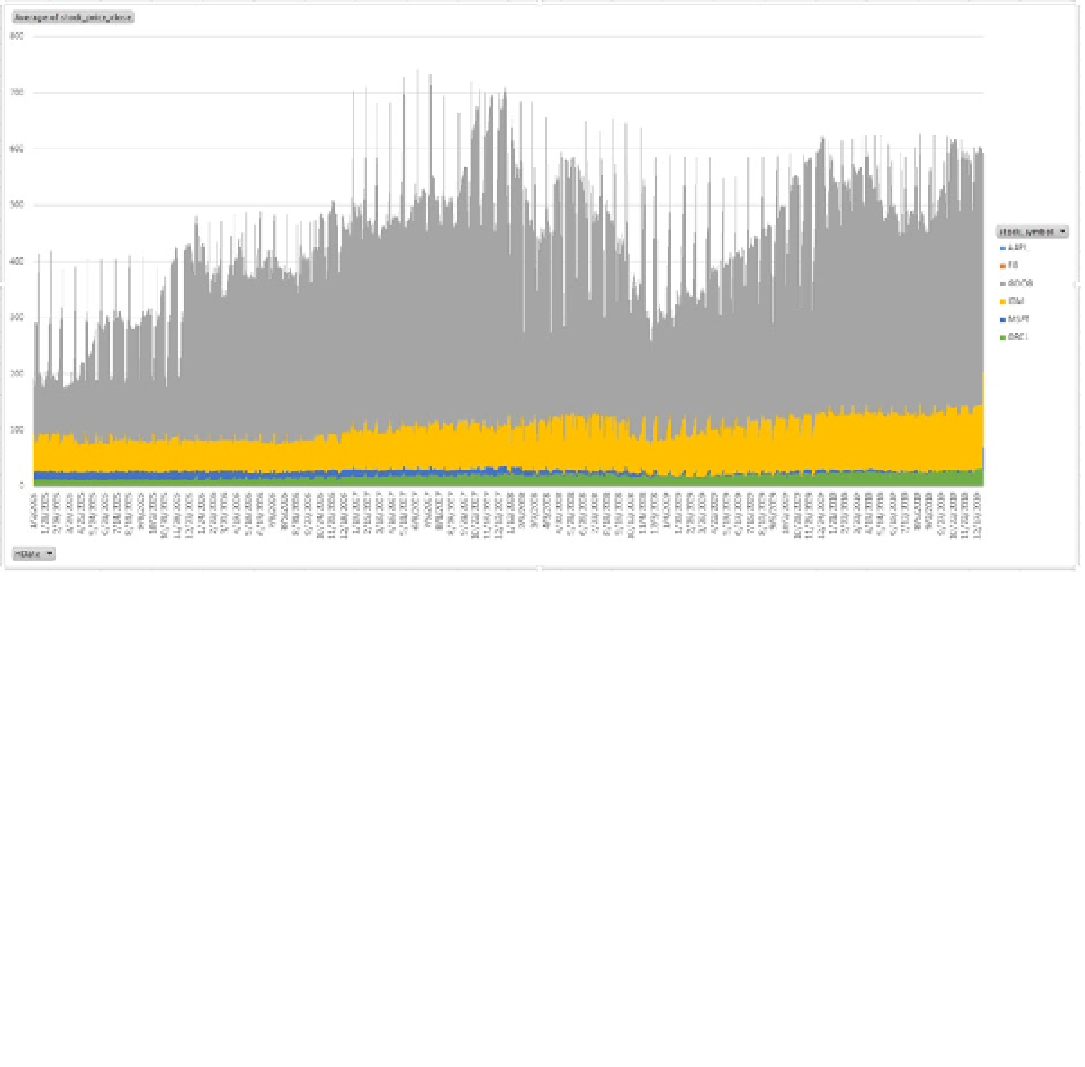
Figure 9-20.
The stock summary chart
In the next section, you will see how you can use Power View to consume the PowerPivot data model and quickly
create intelligent and interactive visualizations out of the stock market data.
Power View for Excel
Power View is a feature of Microsoft Excel 2013, and it's also a feature of Microsoft SharePoint 2013 as part of the SQL
Server 2012 Service Pack 1 Reporting Services Add-in for Microsoft SharePoint Server 2013 Enterprise Edition. Power
View in Excel 2013 and Power View in SharePoint 2013 both provide an interactive data exploration, visualization, and
presentation experience for all skill levels, and they have similar features for designing Power View reports.
This chapter shows a sample Power View report based on the
stock_analysis
table's data in Hive to give you
a quick look at the powerful visualization features from the surface level. Details about how to design a Power View
report as well as details about Power View integration with SharePoint are outside the scope of this topic. Neither
topic is discussed in depth.
■
Note
power view is supported only in excel 2013.
To create a Power View report based on the PowerPivot data model created earlier, open the workbook with the
PowerPivot model, click on the
Insert
ribbon in Excel, and select
Power View
as shown in Figure
9-21
.