Environmental Engineering Reference
In-Depth Information
30
5
u
ref
u
A
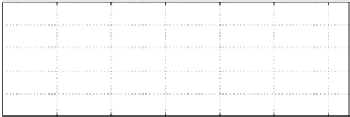
THD of
u
A
=1.27%
4
15
3
0
2
−15
1
−30
0
4
5
i
A
THD of
i
A
=1.53%
4
2
3
0
2
−2
1
−4
0
0
0.01
0.02
0.03
0.04
0.05
0.06
0.07
0.08
0
5
10
15
20
25
30
Time [s]
Harmonics order
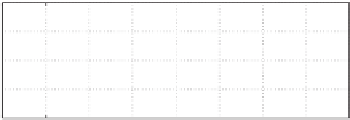
(a)
u
A
, its reference
u
ref
and current
i
A
(b) Voltage THD and current THD
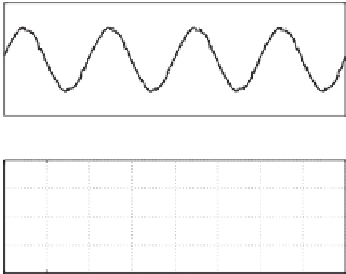
Figure 6.8
Experimental results in the stand-alone mode with a resistive load
load current. The recorded local voltage THD was 1
.
27% while the grid voltage THD was
1
8%. Since the utility grid voltage was used as the reference, it is worth mentioning that the
quality of the inverter local load voltage was better than that of the grid voltage, even without
using an active filter.
.
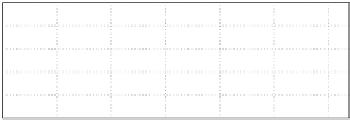
6.6.1.2 With a Non-linear Load
The local load voltage
u
A
, voltage reference
u
ref
and filter inductor current
i
A
are shown in
Figure 6.9(a). The spectra of the inverter local load voltage and the local load current are shown
in Figure 6.9(b). The recorded local load voltage THD was 4
.
73% while the grid voltage THD
30
5
u
ref
u
A
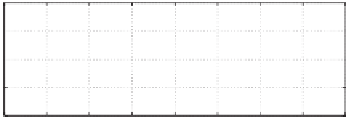
THD of u
A
=4.73%
4
15
3
0
2
−15
1
−30
0
4
i
A
THD of i
A
=80.74%
60
2
40
0
20
−2
−4
0
0
0.01
0.02
0.03
0.04
0.05
0.06
0.07
0.08
0
5
10
15
20
25
30
Time [s]
Harmonics order
(a)
u
A
, its reference
u
ref
and current
i
A
(b) Voltage THD and current THD
Figure 6.9
Experimental results in the stand-alone mode with a non-linear load


Search WWH ::

Custom Search