Environmental Engineering Reference
In-Depth Information
30
5
u
A
u
B
u
C
THD of u
A
=1.27%
4
15
3
0
2
−15
1
−30
0
4
5
i
A
i
B
i
C
THD of i
A
=1.46%
4
2
3
0
2
−2
1
−4
0
0
0.01
0.02
0.03
0.04
0.05
0.06
0.07
0.08
0
5
10
15
20
25
30
Time [s]
Harmonics order
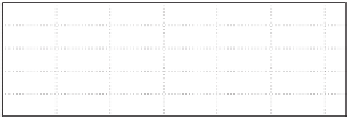
(a) Local load voltage and currents
(b) Voltage THD and current THD
Figure 6.10
Experimental results in the stand-alone mode with an unbalanced load
was 1
78%. The experimental results demonstrate satisfactory performance of the voltage
controller for non-linear loads.
.
6.6.1.3 With an Unbalanced Load
The inverter local load voltage and the local load currents are shown in Figure 6.10(a) with
their spectra shown in Figure 6.10(b). The recorded local load voltage THD was 1
.
27% while
the grid voltage THD was 1
77%. Since the control structure adopts separate controllers for
each phase, the unbalanced loads had no influence on the voltage controller performance and
the inverter local load voltages remained balanced.
.
6.6.2 Steady-state Performance in the Grid-connected Mode
The current reference of the grid current
I
d
was set at 2 A (corresponding to 1
41 A RMS),
after connecting the inverter to the grid. The reactive power was set at 0 Var (
I
q
.
0). The
resistive, non-linear and unbalanced loads used in the previous subsection were used again.
Moreover, the experiment without a local load was carried out as well. Finally, the transient
responses of the system were evaluated.
=
6.6.2.1 Without a Local Load
The experimental results of the grid-connected inverter without a local load connected to the
system are shown in Figure 6.11 for the current-voltage
H
∞
repetitive controller (left column)
and the PR current-
H
∞
repetitive voltage controller (right column). The recorded THD of the
local voltage was 0
99% for the cascaded current-voltage
H
∞
repetitive controller and 0
.
.
99%
for the PR controller, while the grid voltage THDwas 1
.
58% and 0
.
96% respectively. The THD


Search WWH ::

Custom Search