Environmental Engineering Reference
In-Depth Information
30
4
u
ref
u
A
i
ref
i
a
15
2
0
0
−15
−2
−30
−4
4
2
e
u
e
i
2
1
0
0
−2
−1
−4
−2
−0.1
0
0.1
0.2
0.3
0.4
−0.1
0
0.1
0.2
0.3
0.4
Time [s]
Time [s]
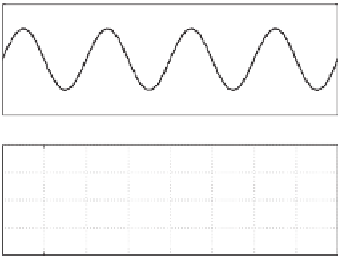
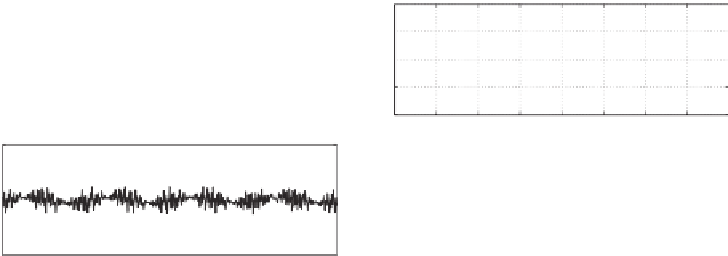
(a) Voltage
u
A
, its reference
u
ref
and the
(b) Grid current
i
a
, its reference
i
ref
error
e
u
and the error
e
i
Figure 5.12
Transient response to a 1 A step change of
I
d
in the grid-connected mode without a local
load
00 Hz, the results when the frequency-adaptive mecha-
nism was enabled and was not enabled are shown in Figure 5.13. Because the frequency was
the same as the nominal value, the results are comparable.
When the grid frequency was not 50
When the grid frequency was at 50
.
00 Hz, the results when the frequency-adaptive mech-
anism was enabled and was not enabled are shown in Figure 5.14 for the grid frequency of
49
.
.
85 Hz, 49
.
90 Hz and 49
.
95 Hz and in Figure 5.15 for the grid frequency of 50
.
05 Hz, 50
.
10
Hz and 50
15 Hz, respectively. The improvement in the mechanism can be clearly seen from
the figures. A phase shift between the voltage output
u
A
and the reference voltage
u
ref
was
noticeable, which increased the steady-state tracking error. Since the controller was tuned for
the grid frequency at 50
.
00 Hz, the generated voltage
u
A
was leading the reference voltage
when the grid frequency was below 50
.
.
00 Hz, as shown in Figure 5.14, and the generated
30
30
u
ref
u
A
u
ref
u
A
15
15
0
0
−15
−15
−30
−30
4
4
e
u
e
u
2
2
0
0
−2
−2
−4
−4
0
0.01
0.02
0.03
0.04
0.05
0.06
0.07
0.08
0
0.01
0.02
0.03
0.04
0.05
0.06
0.07
0.08
Time [s]
Time [s]
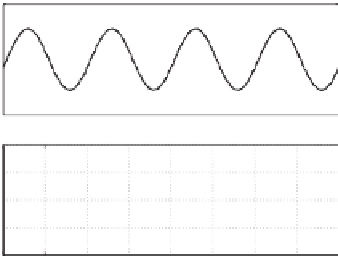
(a) with the frequency-adaptivemechanism
(b) without the frequency-adaptive mechanism
Figure 5.13
Responses when the grid frequency was at
f
=
50
.
00 Hz


Search WWH ::

Custom Search