Biomedical Engineering Reference
In-Depth Information
The residual plot of the rotor is seen in Figure 15, which shows that the
solution has not converged. Further analysis is required to produce fully
converged results.
The static pressure contours are shown in Figure 16 for the experimental
rotor.
Reproduced with permission. Copyright retained by Inderscience Publishers.
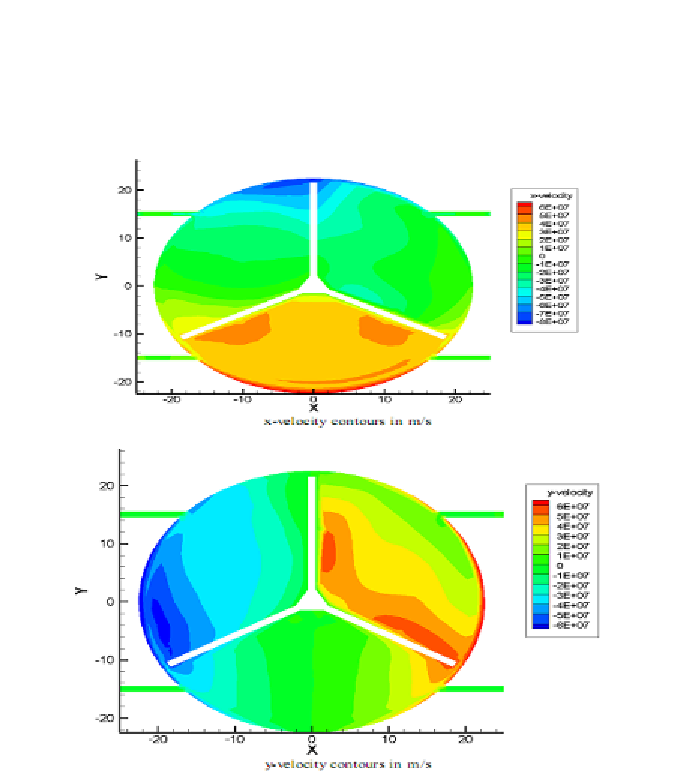
Figure 17. Velocity contours for the experimental rotor.
The x- and y-velocity contours are shown in Figure 17, whilst Figure 18
shows the total pressure exerted with accompanying flow lines.
The magnitude of velocities and pressure are too high and thus indicates
us to re-evaluate our boundary conditions used in the problem. Additional
computations can be done with a much denser grid to capture the unsteady
dynamics of the problem.