Database Reference
In-Depth Information
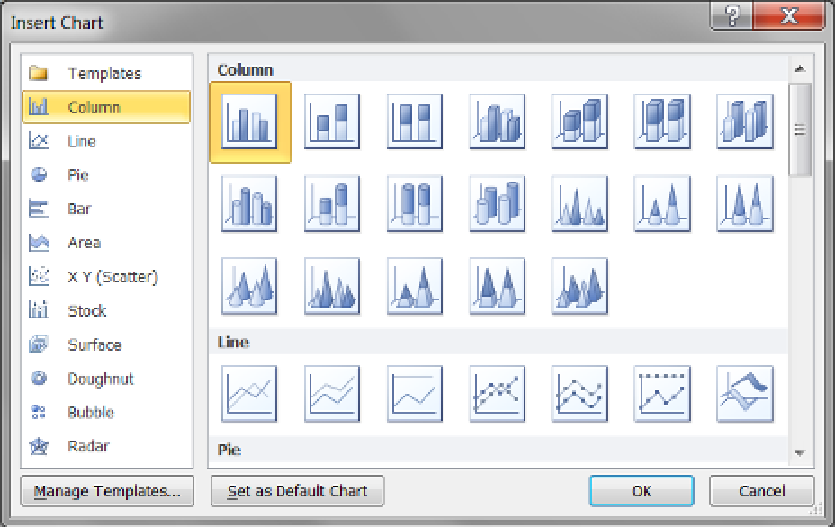
Figure 15-27.
Selecting a PivotChart layout
As you can see in Figure
15-27
, there are a number of chart types to choose from, and even more can be
downloaded from the Internet. You can create your own templates as well.
We recommend selecting simple charts such as columns and bars to start with. In our example, we use a
column graph by highlighting the first column graph template, as shown in Figure
15-27
, and clicking the OK
button.
Immediately after clicking the OK button, a PivotChart is added to your Excel worksheet. This chart will
likely be floating over the top of at least part of your pivot table. Drag and drop it to the desired location.
In Figure
15-28
we moved the PivotChart to the right side of the pivot table.