Hardware Reference
In-Depth Information
50
0
−50
−100
10
0
10
1
10
2
10
3
10
4
10
5
10
6
0
−100
−200
−300
−400
10
0
10
1
10
2
10
3
10
4
10
5
10
6
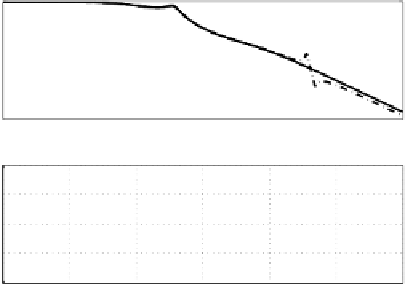
Frequency (rad/s)
Figure 3.2: Open loop Bode plot with controller given by equation 3.14 with
crossover frequency chosen f
v
= 500 Hz = 3142 rad/s. Solid line: Rigid body
plant of equation 3.12, and Dashed-line: Plant with resonant mode as modeled
by equation 3.13.
−150
−155
−160
−165
−170
10
0
10
1
10
2
10
3
10
4
10
5
10
6
50
0
−50
10
0
10
1
10
2
10
3
10
4
10
5
10
6
Frequency (rad/s)
Figure 3.3: The Bode plot of the controller G
c
(s) corresponding to Figure 3.2.
andevenpoweramplifier bandwidth which are ignored in equation 3.9 become
prominent when servo bandwidth is increased.
The crossover frequency and thus the servo bandwidth can not be increased
arbitrarily in presence of actuator resonances. The resonance modes of the
actuator add phase lag and limit the achievable servo bandwidth. Methods