Environmental Engineering Reference
In-Depth Information
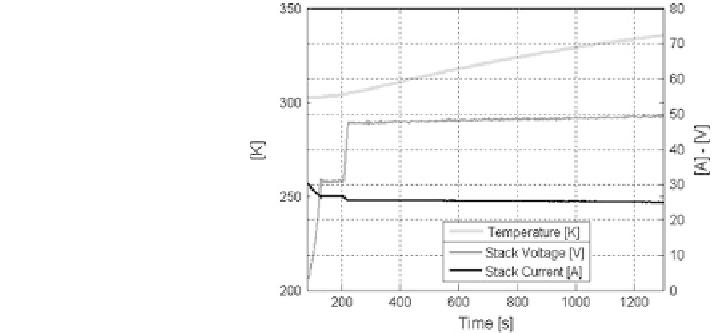
Fig. 6.18 Acquisition versus
time of stack voltage, current,
and temperature during a
steady-state test at 1.2 kW
(R = 1.9)
in particular those closer to the end plates, are more sensitive to flooding since
purge intervention permits a clear voltage recovery.
The effect of the humidification strategy can be deducted by analyzing a third
acquisition window (2180-2400 s) for the experiment of Fig.
6.11
, shown in
Fig.
6.16
, where the individual cell voltage and hydrogen pressure measured at
anode inlet are reported versus time.
The Fig.
6.11
evidences that during this time window three different steady-state
conditions are reached at 338 K, when the stack load decreases from 1.5 to
0.15 kW. In detail, the stack current is hold at 40 A (1.1 kW) for about 60 s, at 23 A
(0.7 kW) for 40 s, and finally at 5 A (0.15 kW) for 30 s. During the entire test phase
both purge and humidification management appear to be suitable for the optimal
stack operation. This is evidenced by maximum C
v
peaks of 1.5% in correspon-
dence with purge intervention (at 2250 s, Fig.
6.12
) and 1.4% at 2315 s due to
external humidification, whose effect becomes more evident at lower stack power
(from 0.7 kW), when the purge is not utilized and the minor water production
enhances the membrane dehydration. The voltage recovery of individual cells due
to external humidification is detailed in Fig.
6.17
, where the voltage is reported for
three instants, just before the second cell voltage reduction (2280 s in Fig.
6.16
),
then for the instant corresponding to the maximum of this peak (2312 s), and for the
final value after the stabilization of the voltage (2315 s). In spite of the particular
sensitivity of some cells (N.6 and N.28) to water management, the C
v
values result
acceptable also for the last phase of the experiment of Fig.
6.11
.
In order to clarify the effectiveness of the external humidification strategy in
stack managing, a further experiment is shown in Figs.
6.18
and
6.19
. This test is
effected in a steady-state condition corresponding to the maximum efficiency of
the FCS at 1.2 kW and R = 1.9. Stack current, voltage, and temperature are
reported as function of time in Fig.
6.18
, while C
v
and hydrogen pressure are
shown in Fig.
6.19
.
During this test, the stack temperature is left rising from 303 to 338 K, with a
variable increase rate from 2.5 to 1.5 K/min. The regular stack operation is