Environmental Engineering Reference
In-Depth Information
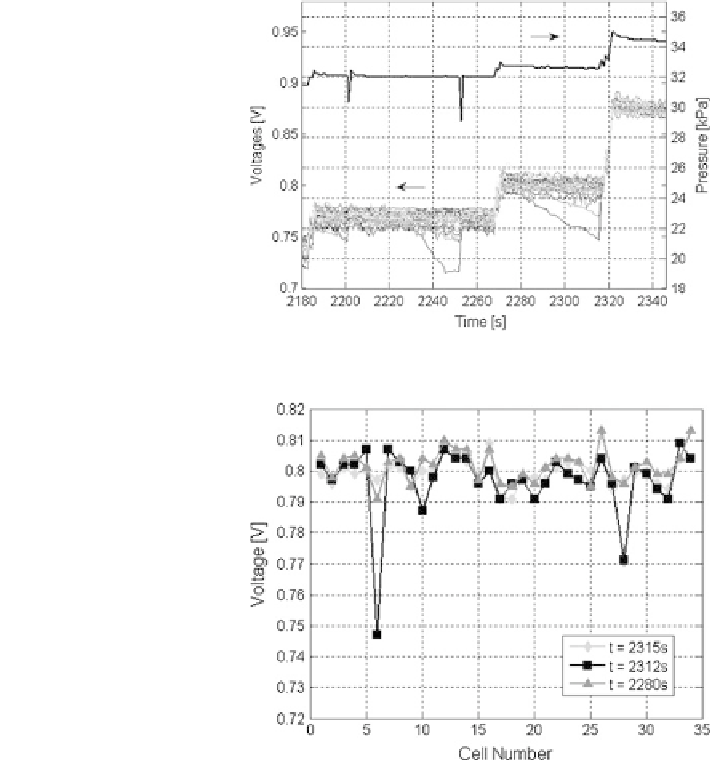
Fig. 6.16 Acquisition versus
time of individual cell voltage
and hydrogen relative pres-
sure at anode inlet for a par-
ticular time window
(2180-2400 s) of the experi-
ment of Fig.
6.11
Fig. 6.17 Individual cell
voltage during humidification
intervention for the experi-
ment of Fig.
6.16
(1820-2120 s in Fig.
6.11
). No temperature control is adopted during this period of
test, obtaining a temperature increase from 315 to 333 K at about 3 K/min. The
result in terms of individual cell voltage and inlet hydrogen pressure as function of
time is reported in Fig.
6.14
, that shows as the effect of the purge determines a
stronger positive effect on cell voltage recovery with respect to the lowest load
conditions. In fact, several peaks of C
v
reach values slightly higher than 2%, indi-
cating faster but still tolerable flooding phenomena in some individual cells
(Fig.
6.12
).
A detail of individual cell voltage acquisition during one single purge operation
is reported in Fig.
6.15
, which refers to the purge peak at about 1870 s corre-
sponding to the stack power of 2 kW (Fig.
6.14
).
The three curves correspond to three acquisition instants, two of them before
the purge, and the third one just after it. This last figure evidences that some cells,