Environmental Engineering Reference
In-Depth Information
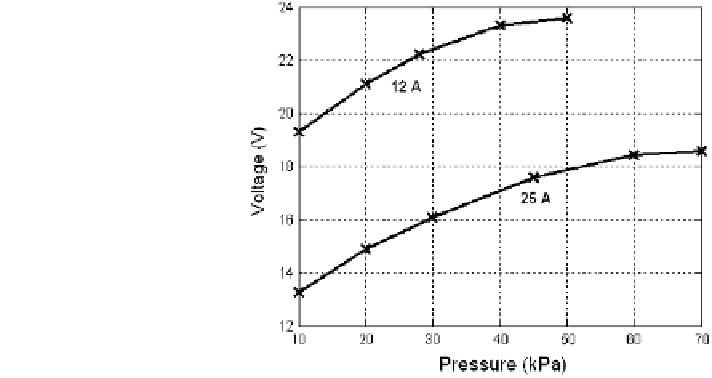
Fig. 3.6 Effect of air pres-
sure on stack voltage for a
500 W PEM stack at two
values of stack current.
T = 333 K, R = 2,
p
H
2
¼
10 kPa
manufacturer, while the other experimental conditions are indicated in the figure
legend.
The positive effect of pressure is evident at both the current values considered,
in particular if the air pressure is increased at 12 A from 10 to 50 kPa, a stack
voltage gain of about 4 V is obtained, while raising the air pressure up to 70 kPa at
25 A, a stack voltage of 18.5 V is observed, with an increase of about 5 V with
respect to the value at 10 kPa. An analogue behavior can be observed when the
hydrogen pressure is increased, with a stack voltage gain of about 2 V for a
pressure raise from 10 to 20 kPa (data not shown in Fig.
3.6
).
A higher polarization curve when cell operating pressure is increased can be
expected on the base of the Nernst equation (
3.15
), but the concomitant increase of
i
0
, due to the higher concentration of reactant gases on electrodes, with the con-
sequent improvement of the hydrogen/oxygen reaction rate, has to be also con-
sidered [
34
].
The effect of stack temperature on the polarization curve is shown in Fig.
3.7
,
for the temperature range 303-333 K.
Figure
3.7
shows that varying the stack temperature from 303 to 333 K, a
voltage increase of about 10% is obtained at all current values after 2 A. This
effect cannot be significantly enhanced because of the narrow temperature range
which is usually adopted in real stacks (comprised between 300 and 350 K).
Since the electrochemical reaction (
3.13
) is exothermic (Table
3.1
), a potential
loss should be expected by thermodynamics; however, the results reported in
Fig.
3.7
evidence that kinetic implications are prevalent in determining the global
effect of temperature on stack efficiency, in particular the increase in the exchange
current density and the improvement of mass transport properties can be invoked
to explain the behavior represented.
The effect of the stoichiometric ratio on the stack performance is shown in
Fig.
3.8
in terms of total stack voltage versus R for different values of current.