Environmental Engineering Reference
In-Depth Information
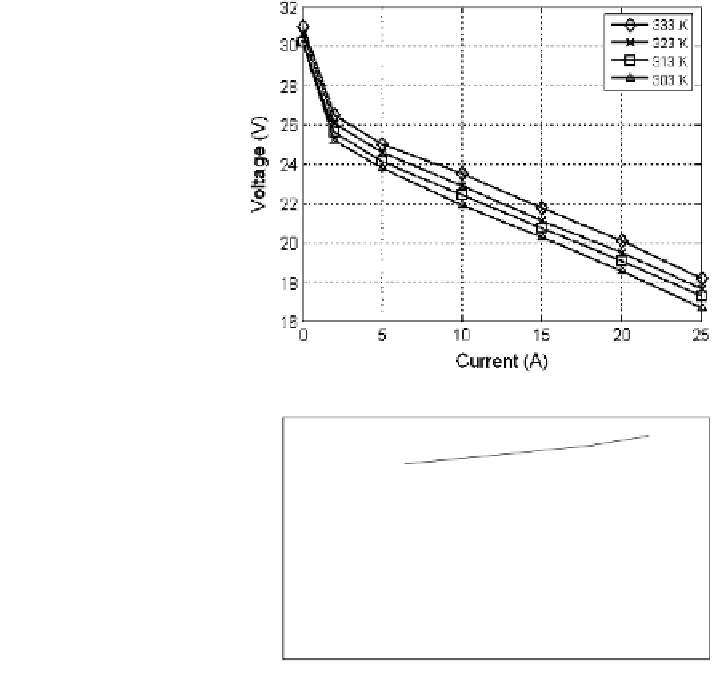
Fig. 3.7 Effect of tempera-
ture on the polarization curve
of a 500 W PEM stack.
R = 2-5, p
air
= 60 kPa,
p
H
2
¼
20 kPa
Fig. 3.8 Effect of the stoi-
chiometric ratio R on total
stack voltage V
T
for a 500 W
PEM stack at different values
of current. T = 303-313 K,
p
air
= 10-50 kPa,
p
H
2
¼
10 kPa
V
T
[V]
2 A
25
5 A
23
10 A
21
19
20 A
17
15
0
2
4
6
8
10
12
R
The oxidant is easily supplied to a PEM stack as air fed by compressor. In order to
obtain satisfactory and uniform performance for all cells in the stack it is necessary to
feed an excess of air with respect to the stoichiometric reaction of hydrogen oxidation
(R [ 1), to overcome the limitations on mass transport on the cathode side.
The experimental data of Fig.
3.8
show that the effect of R on stack perfor-
mance is limited at low current (2-5 A), and becomes more evident increasing the
load (5-20 A); however, for all current values it is advantageous to run the stack at
R [ 2. The upper limit of R which is convenient to use in different conditions
depends on the load that is on the hydrogen flow rate consumed at the anode side.
In fact to assure an excess of air at high current implies a not negligible power
consumption of the compressor used to supply the oxidant to the cathode side.
Also this aspect is closely examined in
Chap. 4
and in case studies of
Chaps. 6
and
7
, but it is anticipated here by the analysis of data reported in Fig.
3.9
, where
the ratio between the power absorbed by the air compressor used for the tests of
Fig.
3.8
and the power supplied by the stack is plotted versus the power supplied
by the fuel cell system (FCS power). The results show that an acceptable