Environmental Engineering Reference
In-Depth Information
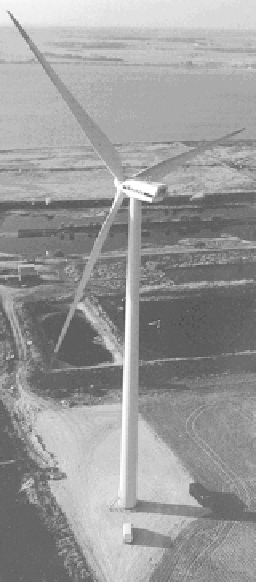
Figure 2.6
The Vestas V90, 3 MW wind turbine. (Reproduced with permission of Vestas Wind
Systems A/S)
where
is the air density,
A
is the rotor swept area,
U
is the wind speed and
C
p
is the power
coeffi cient that represents the aerodynamic effi ciency of the rotor. The variability in power
output from one wind turbine would therefore be expected to substantially exaggerate the
variability shown in the time histories of Figure 2.3.
Wind turbines are designed to generate their rated or nameplate output at a rated wind
speed
U
r
. For wind speeds below a cut-in wind speed
U
co
the wind turbine is not operational
as the developed aerodynamic torque is not suffi cient to overcome the frictional losses of the
drivetrain and generate a useful power. For wind speeds above rated the power is controlled
aerodynamically to maintain the output at the rated value until some limiting wind speed
value is reached, known as the cut-out wind speed
U
co
at which point the turbine is shut down.
The relationship between power and wind speed is known as a power curve. A power curve
for a 3 MW wind turbine illustrated in Figure 2.6 is shown in Figure 2.7. For this machine
U
ci
= 3.5 m/s,
U
r
= 15 m/s and
U
co
= 25 m/s, values which are typical of large modern
turbines.
This power characteristic combined with temporal variations in wind speed produces time
varying electricity generation once the long term wind speed variations have been expressed
in terms of a frequency or probability distribution of the sort shown in Figure 2.5. This can
be combined with the power curve to indicate the probabilities of different power outputs,
ρ