Environmental Engineering Reference
In-Depth Information
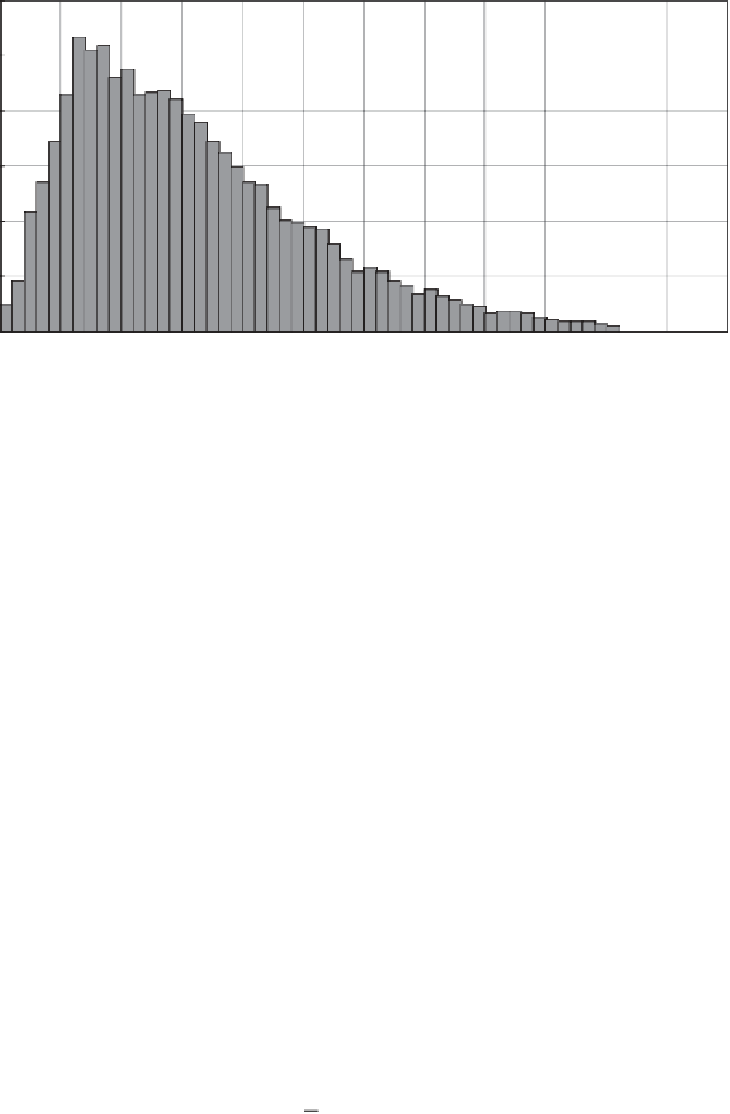
Frequency distribution of Wind Speed
0.06
0.05
0.04
0.03
0.02
0.01
0.00
Wind Speed (m/s)
Figure 2.5
Example wind speed frequency distribution
typically 3 to 5 days, are slow in the context of the operation of large power systems. Appar-
ently more diffi cult to deal with is the impact of short term variations due to wind turbulence,
which are clear on the right hand side of Figure 2.4. However, as will be shown later, the
aggregation effects will reduce this problem considerably. Fortuitously it is the timescales at
which there is least variation, the so called spectral gap between 10 minutes and an hour or
two, that pose the greatest challenge to power system operation.
The essential characteristics of the long term variations of wind speed can also be usefully
described by a frequency or probability distribution. Figure 2.5 shows the frequency distribu-
tion for a year of 10 minute means recorded at Rutherford Appleton Laboratory, Oxfordshire,
UK. Its shape is typical of wind speeds across most of the world's windier regions, with the
modal value (the peak) located below the mean wind speed and a long tail refl ecting the fact
that most sites experience occasional very high winds associated with passing storms. A
convenient mathematical distribution function that has been found to fi t well with data, is the
Weibull
probability density function. This is expressed in terms of two parameters,
k
, a shape
factor, and
C
, a scale factor that is closely related to the long term mean. These parameters
are determined on the basis of a best fi t to the wind speed data. A number of mathematical
approaches of differing complexity are available to perform this fi tting [5, 6] .
2.4.3 Wind Turbines
The power in the wind than can be extracted by a wind turbine is proportional to the cube
of the wind speed and is given in watts by:
1
2
3
P
=
ρ
AUC
p