Database Reference
In-Depth Information
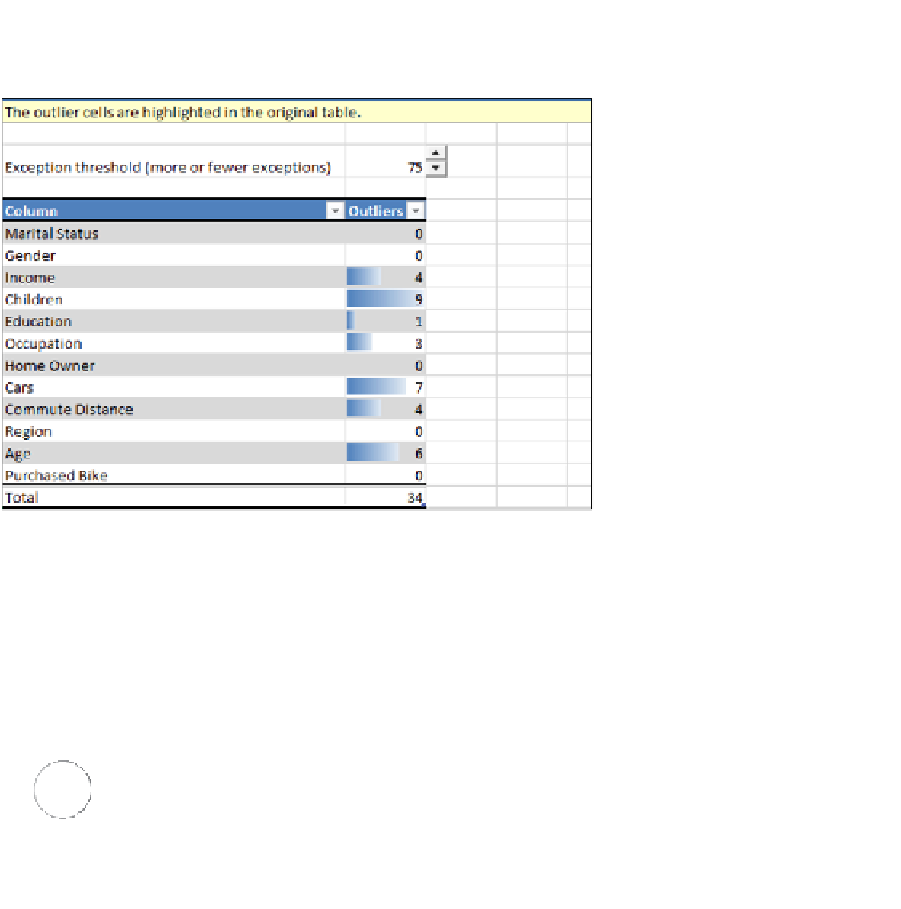
Figure 14-11:
Results of the Highlight Exceptions report.
This report provides a threshold that shows 75 exceptions by default (you can change the threshold;
the rows in the actual input table will be correspondingly highlighted). The data table shows you two
columns, one for each input column where outliers were detected and another showing the number
of outliers that were detected. In this report, you can see that there are 9 outliers for the Children
input column. If you want to see which values actually constitute these outliers, you can go back to
the source table and find them — they're highlighted.
There is no simple way to isolate the outlier values in the input dataset other than sort-
ing the columns (in the event that outliers are at the beginning or end of the value
range) or scrolling through the dataset to find the highlighted outliers. For this reason,
the Highlight Exceptions tool is not practical for large datasets.
Note
Scenario Analysis
A common data analysis scenario is understanding the impact to other columns given a hypothetical
value (or set of values) in an input column that is designated as a target column. The Scenario
Analysis tool does exactly this, but it is actually two different tools: Goal Seek Scenario and What-If
Scenario.


Search WWH ::

Custom Search