Environmental Engineering Reference
In-Depth Information
For example, expert knowledge which suggests that in a specific environment, a
farmer will “plant maize on a
date later than April first
, if it has
not rained for the
last three days
, and when
average air temperature has been above five °C
for
seven
days continuously
” can be formalized and used in simulations. The italicized words
are the parameters of the rule to be compared with system states/exogenous
variables at run-time (e.g. the condition “no rain for the last seven days” is tested
against the values of rain at run time starting from April first as in this example).
The possible uses of such formalization include building a consistent quantitative
database of agricultural management across Europe, optimising parameters in climate
change scenarios as an adaptation strategy and using such metrics in climate change
impact assessments, and improving technical management in current conditions
through rule-parameter optimization. Parameters are needed by model components
to implement the impact of management actions. Some are common to many
management events (e.g. management type) while others apply to a specific man-
agement event (e.g. amount of water for irrigation, tillage depth for tillage). Other
parameters are needed by specific modelling approaches and generally differ even
within specific management event types (e.g. implement type and an associated set
of eight parameters is needed for modelling tillage according to the WEPP (Water
Erosion Prediction Project) approach, Alberts et al.
1995
, as opposed to other
approaches which do not need such information). All model components reference
the AgroManagement data-types to trigger management impact models at run-
time. An example of the graphical representation of a management configuration
for a 3-year rotation is shown in Fig.
4.3
.
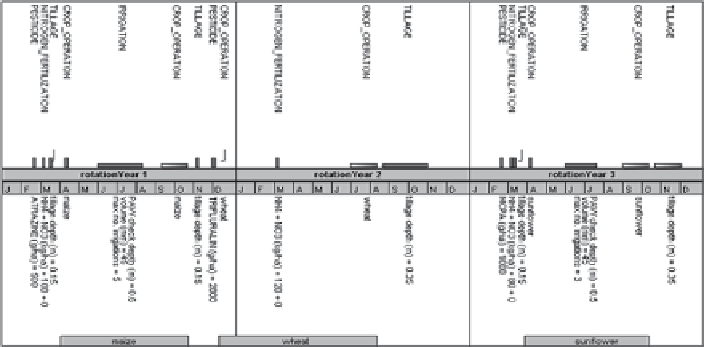
Fig. 4.3
Agro-management scheduled actions in a 3 year rotation. For simulations longer than
this, the sequence is repeated. Vertical bars in the upper section of the graph are actions scheduled
at a relative (to year) date; horizontal bars are actions scheduled in a time window, if other conditions
are met; horizontal bars with a shading gradient are actions scheduled with an end date but
associated with a phenological event (the width of gradient boxes is arbitrarily fixed as 30 days in
this graphical representation)