Environmental Engineering Reference
In-Depth Information
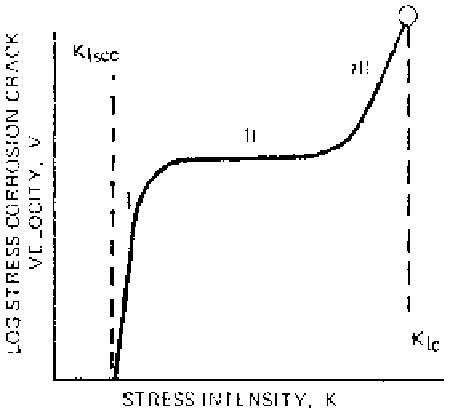
Figure 3.39
Schematic relationship between stress intensity factor and crack growth
rate for stress corrosion cracking.
in preference to the alloys with a high-plateau velocity under the similar condi-
tions of the environment.
It has been shown [10] that high-strength titanium alloys that were thought
to be immune to SCC in dilute aqueous chloride environments on the basis of
smooth specimen stress corrosion tests are in fact highly susceptible when evalu-
ated using fatigue-precracked specimens. Actually, these alloys are resistant to
pitting in these environments and stress corrosion crack initiation through pitting
does not take place. However, preexisting flaws and defects make these alloys
susceptible to SCC.
In slow-strain rate testing
, a smooth or a precracked specimen exposed to the
corrosive environment is pulled at a low cross-head speed (10
5
to 10
9
m/s) to
failure. The elongation to failure (or any other tensile property such as reduction
in area, ultimate tensile strength, or fracture energy) is plotted against strain rate,
as shown in Fig. 3.40. The plot shows that a narrow range of strain rate exists
where the ductility is minimum, which is indicative of SCC. At higher strain
rates film formation, which is important in the initiation of a stress corrosion
crack, cannot keep pace with the mechanical plastic strain. At very low strain
rates, the ruptured film is healed before a stress corrosion crack can be initiated
through an intense corrosive attack at the rupture sites. In both cases, the pulled
sample fractures in a ductile manner.
The slow strain rate technique has the advantage over the constant strain or