Information Technology Reference
In-Depth Information
Fig. 4.
Normal Trac vs. Trac with Injected Nodes
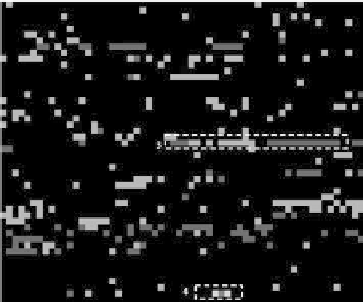
Fig. 5.
PeekKernelFlows Results for Source (left) and Destination (right) Profile
a revised method of T.R.A.C.E. (Total Recognition by Adaptive Classification
Experiments). It is a supervised learning algorithm that estimates
k
barycenters
for each class and data is assigned to a class such that the Euclidean distance to
a barycenter is minimal. The K.-T.R.A.C.E input are similarity scores estimated
by the kernel function
K
(
T
n
,T
m
)=
s
(
a
i
,b
j
)
v
(
a
i
,b
j
). By adjusting the different
parameters in the kernel function, classification results between 77 to 98% were
obtained.
In the second data set, a high interaction honeypot exposing a vulnerable
ssh-server for 1-day on a public IP-address has been operated and logged. Fig.
5 summarizes the graphical evaluation of the honeypot data set for source (left
picture) and destination (right picture) profiles. The picture resolutions are 1
200
×
20 pixels size each and the
monitoring time is
η
= 5 seconds. A figure holds 4 000 Aguri trees, the equivalent
of 4 hours monitoring. To validate the visual results, a manual investigation of
the data set has been additionally realized. A problem of manual investigations
is that a honeypot is under most different attacks, which can generate a lot of
noise in the data set. In the visual trac representation a lot of 'noise' can be
×
1 000 pixels, Aguri kernel values have a 20
×


Search WWH ::

Custom Search