Information Technology Reference
In-Depth Information
%!AGURI-1.0
%%StartTime: Tue Dec 01 13:54:12 2009 (2009/12/01 13:54:12)
%%EndTime: Tue Dec 01 13:54:44 2009 (2009/12/01 13:54:44)
%AvgRate: 323.40Kbps
[src address] 1293591 (100.00%)
0.0.0.0/5 7531 (0.58%/99.22%)
10.0.0.0/9 13545 (1.05%/30.79%)
10.4.0.13 237599 (18.37%)
10.91.0.0/24 19625 (1.52%/10.09%)
10.91.0.22 110920 (8.57%)
10.91.1.4 16664 (1.29%)
72.0.0.0/5 21618 (1.67%/37.09%)
74.125.79.91 202791 (15.68%)
74.125.79.93 214301 (16.57%)
74.125.79.99 27396 (2.12%)
74.125.79.104 13649 (1.06%)
83.231.205.49 324379 (25.08%)
83.231.205.50 73506 (5.68%)
::/0 10067 (0.78%/0.78%)
%LRU hits: 95.52% (1790/1874) reclaimed: 0
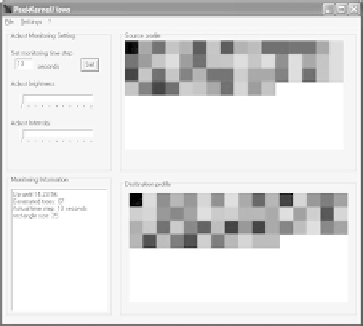
Fig. 2.
PeekKernelFlows GUI
Fig. 3.
Aguri Profile Tree
3 Experimental Results
For the experimental part, two different data sets have been used to evaluate
the framework PeekKernelFlows. The first data set, uses Netflow records from
an ISP and the second data set is from an honeypot [10], both are given in
Table 1. In the experiments, Aguri parameters have been set as such: Aguri-
profile generation
η
set to
η
= 5 seconds and the aggregation threshold
t
=
1%, to give a fine-grained view of the network. In the first part, only source
profiles generated by Aguri have been used. Different tests for the accuracy
evaluation and performance for the kernel function have been done. In Fig.
4, the influence of the kernel function by adding hosts to the network can be
seen. It can be distinguished between normal trac on the network and an
injection attack, where hosts are added to the network, represented by the peek
value. By studying different cases of incidents on networks, it can be illustrate
that a kernel function per se can be helpful in the identification of network
incidents. To validate the kernel function performance, a clustering algorithm
called K.-T.R.A.C.E [1] has been used. The aim is to classify kernel function
values obtained from the network tra
c into attacks or benign tra
c. The K.-
T.R.A.C.E algorithm is a an iterative
k
−
means
algorithm variant, supporting
Table 1.
ISP Network Monitoring Data Set Description
ISP data set
Honeypot data set
Average number of nodes
42
Number of addresses
47 523
Number of flows
3733680
Exchanged TCP packets 1 183 419
Total bytes
19.36G
Operation time
24 hrs
Global capture duration
300 s
Used Bandwidth
64 Kbits/s
Average bandwidth
528Mbit/s
Colour (bit)
24


Search WWH ::

Custom Search