Information Technology Reference
In-Depth Information
Fig. 5 depicts the size of LCC for each of the 32 content categories. It may be ob-
served that the average size of LCC for all content categories remains the same even
if the percentage of malicious peers increases. This shows that the community forma-
tion among the honest peers is not affected by the presence of malicious nodes.
Fig. 5.
Largest connected components for peers having different content categories
Fig. 6 presents how the
closeness centrality
(CC) of good and malicious peers var-
ies in the community topology. It may be observed that the steady state value of CC
for honest peers is around 0.12, irrespective of the percentage of malicious peers in
the network. However, for the malicious peers, the CC value is found to lie between
0.03 to 0.07. This implies that the malicious peers are effectively driven to the fringe
of the network while the good peers are rewarded.
Fig. 6.
Closeness centrality for (a) 20% and (b) 40%
Prob
com
malicious nodes in the network
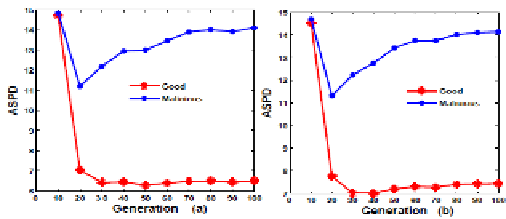
Fig. 7.
Avg. shortest path length vs generations of search at the step of ten for various percent-
ages of malicious peers. In (a) 30% and in (b) 40% nodes are malicious.

Search WWH ::

Custom Search