Information Technology Reference
In-Depth Information
4 Performance Evaluation
To analyze the performance of the proposed scheme, three metrics are defined: at-
tempt ratio, closeness centrality, and largest connected component. These metrics are
discussed below and they are evaluated by simulation.
(1)
Attempt ratio
(AR): A peer keeps on downloading files from various sources
based on their trust rating till it gets the authentic file. AR is the probability that the
authentic file is downloaded in the first attempt. A high value of AR is desirable.
(2)
Closeness centrality
(CC): Since the topology adaptation brings the good peers
closer to each other, the length of the shortest path between a pair of good peers de-
creases. The peers with higher CC values are topologically better positioned. If
P
ij
is
the length of the shortest path between
i
and
j
through community edges and if
V
denotes the set of peers, then CC for peer
i
is given by:
1
CC
=
∑
∈
i
P
.
ij
j
V
(3)
Largest connected component
(LCC): The community edges form a trust-aware
community overlay with the peers sharing similar contents. However, it will be highly
probable that the trust-aware overly graph will be a disconnected graph. LCC is the
largest connected component of this disconnected graph. LCC of the network can be
taken as a measure of the goodness of the community structure.
A discrete time simulator written in C is used for simulation. In simulation, 6000
peer nodes, 18000 connectivity edges, 32 content categories are chosen. To make
their detection difficult, the malicious peers occasionally provide authentic files with
a probability known as the
degree of deception
. The value of this probability is taken
as 0.1. The value of
degree of rewiring
is taken as 0.3. Due to formation of the seman-
tic edges, the degrees of the peers are allowed to increase maximum to the extent of
30%. The TTL values for BFS and DFS are taken as 5s and 10 s respectively. Bara-
basi-Alabert generator is used to generate initial power law graphs with 6000 nodes
and 18000 edges. The number of searches per generation and the number of genera-
tions per cycle are taken as 5000 and 100 respectively.
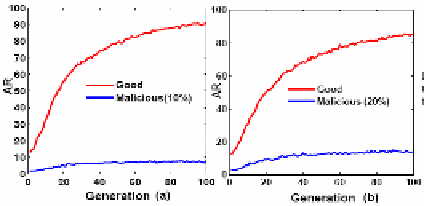
To check the robustness of the algorithm against attack from malicious peers, the
percentage of malicious peers is gradually increased. Fig. 4 illustrates the cost in-
curred by each type of peers (honest and malicious) to download authentic files. It is
evident that with the increase in the percentage of malicious peers, cost for malicious
peers to download authentic files decreases. The reverse is the case for honest peers.
Fig. 4.
AR vs. percentage of malicious nodes. In (a) 10%, in (b) 20% nodes are malicious.
Search WWH ::

Custom Search