Information Technology Reference
In-Depth Information
minima). A simple idea is to determine the similarity between two images A and B
(having the same size) as follows:
No Coincidence Points
Number Minima Pixel A + Number Mimima Pixel B
SIM
=
(10)
with
0
≤≤
Sim
1
. The similarity measure is null zero if the images A and B are
equal and one if A and B have no coincidence by the local minima.
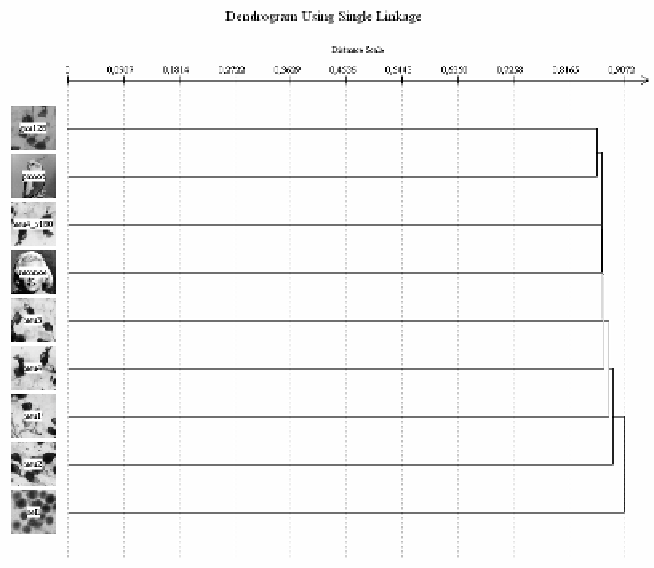
Fig. 35.
Dendrogram based on equation 3
The result is shown in Fig. 35. Our test images are all very dissimilar with this
measure as the dendrogram in Fig. 35 shows. The lowest cophenetic similarity value
is 0.8627 between the gan128 and parrot image. On closer inspection of the regional
minima images from the testing images this result is not surprising, because there are
not many coincidences (compare Fig. 36).
If we use the similarity measure from [18] for the evaluation of testing the local
minima images we are getting from the similarity matrix, all images excluding the
parrot are most similar to the cell. That is the image with the smallest number of local
minima in our set of test images. Furthermore, we observe that the images are in gen-
eral all dissimilar as the dendrogram in Fig. 37 shows. Therefore, we consider this
measure as unsuitable to distinguish between the groups of images versa their seg-
mentation parameters.
Search WWH ::

Custom Search