Information Technology Reference
In-Depth Information
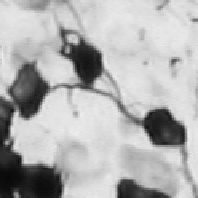
(a) Image neu1
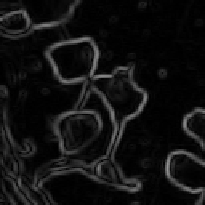
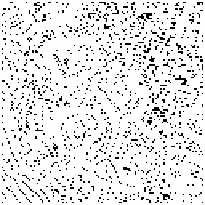
(b) Gradient image of Fig. 36a (c) Image local minima of Fig.
36b
(d) Image neu3
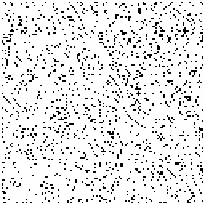
(e) Gradient image of Fig. 36e (f) Image local minima of Fig.
36
Fig. 36.
Orginal image and the local minimas from the gradient image
Fig. 37.
Dendrogram from similarity measure from [18]
More promising are probably the determination of the distances from one regional
minima to all the surrounding minima up to a predefined area and the calculation of
the statistical distribution. Then the problem would be to compare the distribution of
two images. We will further evaluate this idea in another study.





Search WWH ::

Custom Search