Image Processing Reference
In-Depth Information
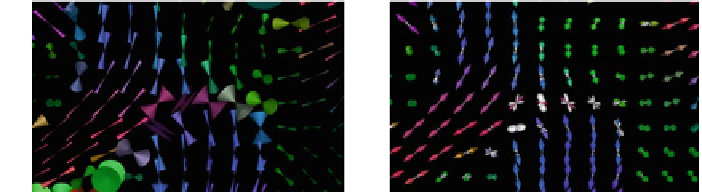
(a)
(b)
Fig. 8.2
Uncertainty in fiber directions has been visualized using cones of uncertainty, which
include 95 % of all estimated directions (
a
)[
31
] The characteristics of the distribution are shown
in greater detail by HiFiVE glyphs, which decompose it into a main direction, shown as
colored
double cones
, and a residual PDF, shown as a
gray surface
(
b
)[
55
]
certain part of the ODF. For tractography, the main features of interest are the inferred
fiber directions. The uncertainty in these directions has traditionally been visualized
using cones that represent 95 % confidence intervals around a main direction [
31
].
Figure
8.2
compares this approach to the alternative, more recent HiFiVE glyph,
which provides a more detailed impression of the distribution [
55
].
8.2.2 Rendering Probabilistic Tractograms
After estimating the reproducibility of white matter fiber tracts by one of the above-
described methods, we can represent the results in one of two ways: voxel-centric
or tract-centric. The voxel-centric representation assigns scores to individual voxels,
where each voxel stores the percentage of tracts passing through it. They represent
the reproducibility with which a connection from one voxel position to the seeding
region is inferred from the data. The resulting 3D volume data sets are sometimes
called probability or confidence maps, and are often visualized by volume rendering
techniques, as in Fig.
8.3
b, and 2D color maps [
40
].
Tract-centric techniques include the ConTrack algorithm [
59
], which assigns a
score to each generated tract. It reflects confidence in the pathway as a whole, based
on its agreement with the data and assumptions on fiber length and smoothness.
Ehricke et al. [
15
] define a confidence score that varies along the fiber, and color
code it on the streamline. Jones et al. [
30
,
32
] use hyperstreamlines to visualize the
variability of fiber tracts obtained using bootstrap or wild-bootstrap methods. They
also demonstrate that using standard streamlines to render all fiber variations equally
fails to give an impression of which fibers are stable and which are outliers.
Brecheisen et al. [
6
] propose illustrative confidence intervals where intervals are
based on distances or pathway scores. Illustrative techniques, i.e., silhouette and out-
lines, are used to visualize these intervals. Interaction and Focus+Context widgets are
used to extend the simplified illustrative renderings with more detailed information.
Search WWH ::

Custom Search