Image Processing Reference
In-Depth Information
(a)
(b)
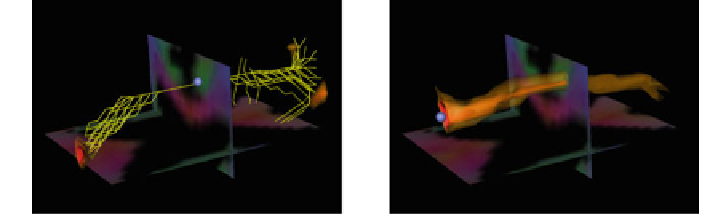
Fig. 8.3
Equally rendering all fiber variations from a seed (
blue ball
) as standard streamlines (
a
)
makes it difficult to see which of them are most stable, and which are isolated outliers. Volumetric
representations (
b
) are a popular alternative. Images from [
53
].
a
Tract-centric visualization, show-
ing all streamlines traced from a common seed.
b
Nested isosurfaces indicate different levels of
confidence
Schultz et al. [
57
] cluster the voxels inwhich probabilistic tractography terminates,
based on the seed points from which they are reached. They then derive a per-voxel
score that indicates how frequently the voxel was involved in a connection between
two given clusters. Fuzzy fiber bundle geometry is defined by isosurfaces of this
score, with different isovalues representing different levels of precision.
8.3 Other Factors
8.3.1 Impact of Parameters
One source of uncertainty in dMRI tractography that has not received much atten-
tion is parameter sensitivity. Most tractography algorithms depend on user-defined
parameters, which results in a poor reproducibility of the output results. Some repro-
ducibility studies for concrete applications have been reported [
13
,
65
]. However,
there does not exist an automatic solution that resolves the problem in a general
manner. The stability of the parameter setting is relevant information for both neu-
roscientists and neurosurgeons who are trying to assess whether their fiber tracking
results are stable. Visualization can play an important role to help this assessment.
Brecheisen et al. [
7
] build a parameter space by sampling combinations of stop-
ping criteria for DTI streamline tractography. Stopping criteria primarily affect fiber
length. The investigation of parameter sensitivity is based on generating a streamline
set that covers the whole parameter space of stopping criteria. Afterwards, selective
culling is performed to display specific streamline collections from the parameter
space. This is done by selecting parameter combinations using 2D widgets such
as the feature histogram displayed in Fig.
8.4
. An example feature is average fiber
density per voxel. These views help the user to identify stable parameter settings,
thereby improving the ability to compare groups of subjects based on quantitative
tract features.
Search WWH ::

Custom Search