Environmental Engineering Reference
In-Depth Information
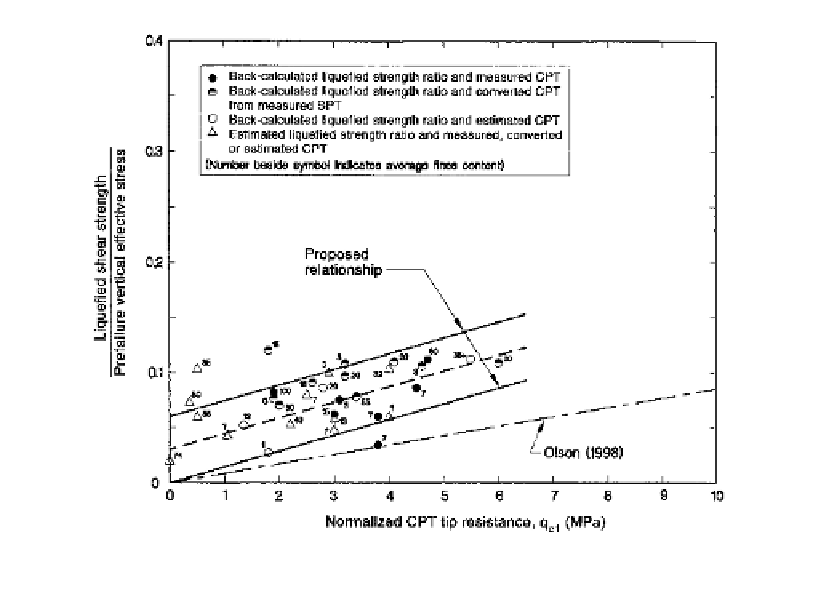
vo
based on normalized cone penetration test q
c1
Figure 12.30.
Liquefied shear strength ratio S
u(LIQ)
/
(Olsen and Stark, 2002).
In
Figure 12.29
:
s o
/
′
(12.26)
where
effective vertical stress.
It is clear there is considerable uncertainty in the estimation of K
s
static shear stress;
vo
will
be less than 1.0 (meaning liquefaction is more likely) for relative densities lower than
about 50%, so, marginal cases should be assumed liquefiable if there are existing shear
stresses, or laboratory tests and analysis of stresses should be carried out to assess the
effects.
Idriss and Boulanger (2003) and Boulanger (2003a, 2003b) present later information
and readers should review the latest literature.
. It seems that K
12.5
POST LIQUEFACTION SHEAR STRENGTH AND STABILITY ANALYSIS
12.5.1
Some general principles
As shown in
Figure 12.7
,
triaxial tests on saturated sands which display strain weakening
behaviour, i.e. those susceptible to flow liquefaction, reach a steady state undrained
strength, S
us
. This is also referred to in the literature as the undrained steady state strength
(Poulos et al., 1985) and undrained residual strength (Seed, 1987).
In field situations, such soils may experience some pore pressure redistribution and the
equivalent term is “liquefied shear strength S
u(LIQ)
”, (NSFW, 1998; Olsen and Stark, 2002).
To check the stability of a dam after the earthquake motion has ceased, a limit equilib-
rium stability analysis is carried out with zones which have been assessed as liquefied
under the earthquake loading and which are subject to flow liquefaction, assigned the