Environmental Engineering Reference
In-Depth Information
1.2
1.0
0.8
D
r
40% (f
0.8)
K
σ
0.6
D
r
≈
60% (f
0.7)
0.4
D
r
80% (f
0.6)
)
f-1
K
σ
(
σ
v
0.2
0
0
1
2
3
4
5
6
7
8
9
10
VERTICAL EFFECTIVE STRESS
σ
v
(atm units,e.g. tst)
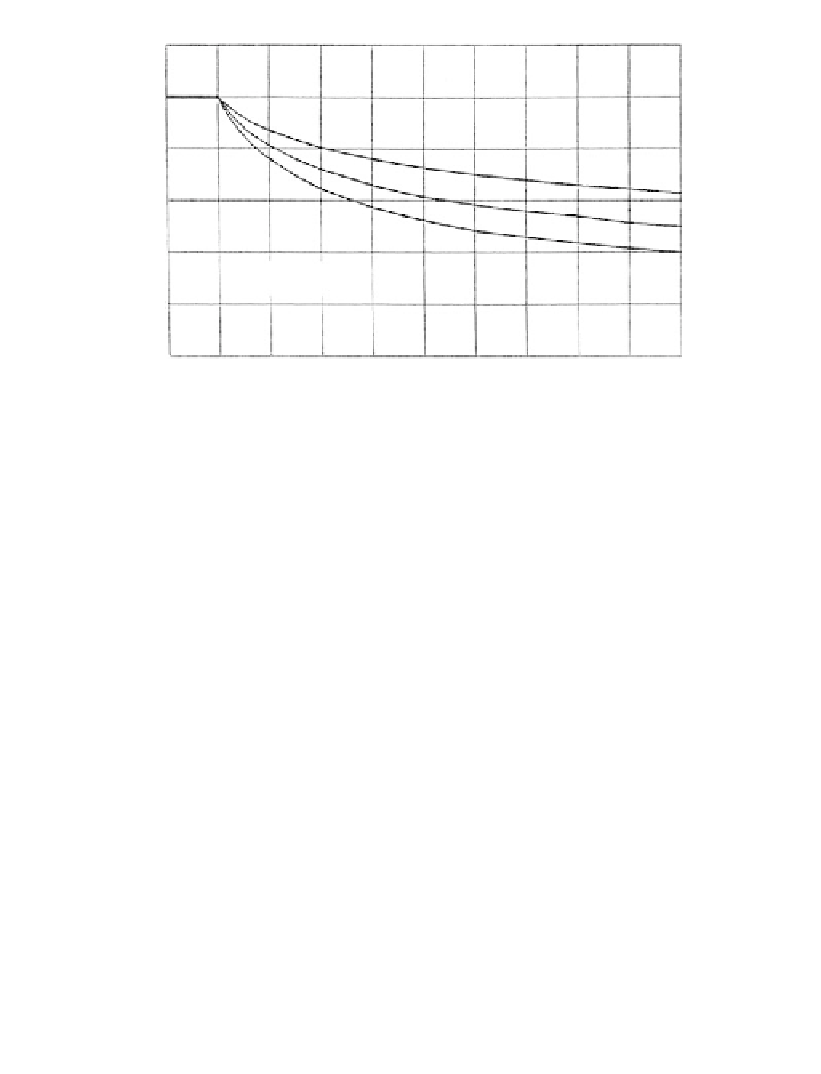
Figure 12.28.
Overburden stress factor K
versus vertical effective stress (Youd et al., 2001, reproduced
with permission of ASCE).
2.0
σ
vo
3 tsf
55-70%
(N
1
)
60
D
r
≈
14-22
≈
1.5
1.0
45-50%
(N
1
)
60
D
r
≈
≈
8-12
D
r
≈
35%
0.5
(N
1
)
60
≈
4-6
0
0
0.1
0.2
0.3
0.4
α
(
τ
s
/
σ
v
o
)
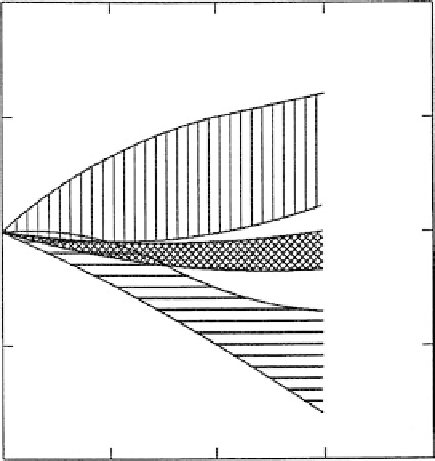
Figure 12.29.
Sloping ground correction factor K
suggested by Harder and Boulanger (1997).
1997), these curves should not be used by nonspecialists in geotechnical earthquake
engineering or in routine engineering practice”.
Harder and Boulanger (1997) suggested the use of
Figure 12.30
for soils with an
effective confining stress less than 300 kPa. They point out that at significantly higher
confining stresses, sandy soils will be more contractive and low K
may be appropri-
ate. For high risk and critical projects on sloping ground or where there are high ini-
tial static shear stresses, they recommend site-specific laboratory testing using high
quality samples.