Agriculture Reference
In-Depth Information
Replication 1
Replication 2
Replication 3
Sub-plots
BV
V
F
B
B
BV
FV
F
BV
VV
B
F
B
BV
FBV
V
B
V
BV
B
F
120 lbs/acre N
120 lbs/acre N
0 lbs/acre N
0 lbs/acre N
120 lbs/acre N
0 lbs/acre N
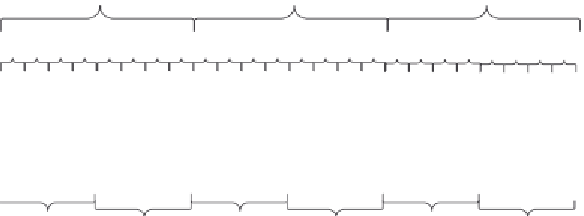
Figure 6.2
Layout of a split-plot design. Main plots are different fertilizer rates (0 or 120 lbs/
acre nitrogen). Subplots are green manures. BV = barley-vetch, V = vetch, F = fallow, and B =
barley. (From Little, T. M., and F. J. Hills. 1978.
Agricultural Experimentation Design and Analysis
. New
York: John Wiley & Sons, p. 89. With permission.)
Table 6.1
Source of variation and degrees of freedom for a split-plot design experiment
SOURCE OF VARIATION
DEGREES OF FREEDOM (DF)
RESULTS OF DF
Replication (rep)
r
- 1
3 - 1 = 2
Main plot (fert)
a
- 1
2 - 1 = 1
Main-plot error (rep#fert)
(
r
- 1)(
a
- 1)
(3 - 1)(2 - 1) = 2
Sub-plot (green)
b
- 1
4 - 1 = 3
Main-plot x sub-plot interaction (fert#green)
(
a
- 1)(
b
- 1)
(2 - 1)(4 - 1) = 3
Sub-plot error (Residual)
a
(
r
- 1)(
b
- 1)
2(3 - 1)(4 - 1) = 12
Note:
Arrows indicate the ratio of mean squares for calculating F values.
Figure 6.2 shows the layout of a split-plot design with fertilizer
rates as the main-plot effects (0 or 120 lbs/acre N) and the subplot
affects green manure effects (barley-vetch, vetch, fallow, or barley) as
the subplot effects. As mentioned previously, the level of precision will
be different for the main plots compared to the subplots and this has
to do with which value is used in the denominator to determine the F
value for each factor. Table 6.1 shows the degrees of freedom with the
arrows indicating the devisors for each factor.
Load the dataset 'Factorial.dta', (Little and Hill, 1978, p. 90) and
enter the following command:
anova
yield rep fert/rep#fert green fert#green


Search WWH ::

Custom Search