Information Technology Reference
In-Depth Information
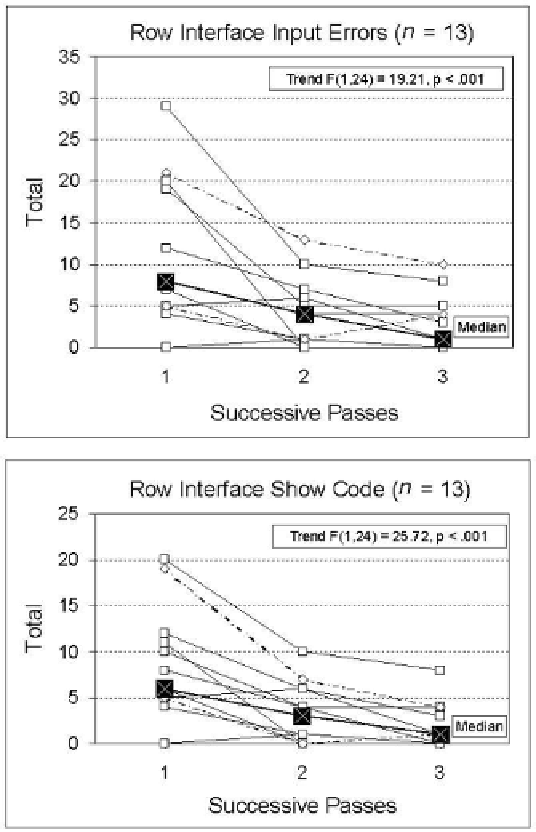
Figure 16. Top view = total errors for each learner across successive passes through the
row interface. The median errors for all passes are also presented. Solid lines are
Completers, and broken lines are Noncompleters, who did not complete the program
interface. Bottom view = total times that each learner selected to see the code in a row across
successive passes. The median times for all passes are also presented
undertaken by comparing the slopes of the regression line for each learner with a population
of zeros was significant, F(1,24) = 25.72,
p
< 0.001.
The correlations between errors and selections for Pass 1, Pass 2, and Pass 3 were as
follows, respectively: Pass 1 — 0.92,
p
< 0.01; Pass 2 — 0.93,
p
< 0.01; and Pass 3 — 0.77,
p
< 0.01. In general, learners who made errors required the support of the selections to observe
the code in a row. This relationship was strong during Passes 1 and 2, and the correlation was
somewhat smaller during Pass 3. The procedure for Pass 3 was more stringent than the other