Information Technology Reference
In-Depth Information
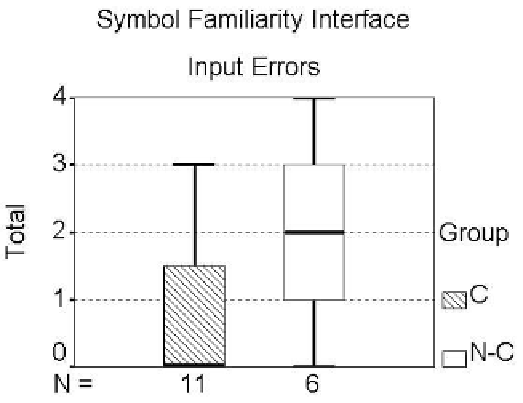
Figure 15. Box-plots of total errors on the item (symbol) familiarity interface for Completers
(C) and Noncompleters (N-C)
the two groups.
The figure graphically shows that the Noncompleters showed greater errors
on this first interactive interface, in comparison to the Completers. The difference in mean
errors was marginally significant between the Completers (mean = 0.8) and the Noncompleters
(mean = 2.0), F(1,15) = 3.44,
p
< 0.09.
Figure 16 (top view) presents the total errors made by each learner across the three
successive passes through the row interface. The individual totals are presented to reveal
at least some of the learning effects at the level of the individual learner. Also presented are
the medians. Because many learners showed identical values across passes, the individual
data points are often on top of each other, but the entire group of 13 learners, all of whom
completed this interface, is presented. The individual data suggest that most learners
dropped in errors across successive passes, but there is graphical evidence that some
learners showed an increase, at least between Pass 2 and Pass 3. Many learners show errors
in excess of the number of rows, especially on the first pass. This is attributable to a learner's
repeated unsuccessful attempts to enter the code on a row. The medians displayed on the
figure clearly show the overall decline in errors across successive passes, as evidenced by
this measure of central tendency. A test of trend undertaken by comparing the slopes of the
regression line for each learner with a population of zeros (Maxwell & Delaney, 2000, p. 597)
was significant, F(1,24) = 19.21,
p
< 0.001.
Figure 16 (bottom view) presents the total times that learners selected to see the code
in a row across successive passes. The form of the figure is similar to the top view, and the
outcome is also similar. Several learners show selections in excess of 10 during the first pass.
Similar to errors, the individual data suggest that most learners dropped in selections across
successive passes, but there is graphical evidence that some learners showed an increase
between Passes 1 and 2 and between Passes 2 and 3. The medians displayed on the figure
clearly show the overall decline in selections across successive passes. A test of trend