Environmental Engineering Reference
In-Depth Information
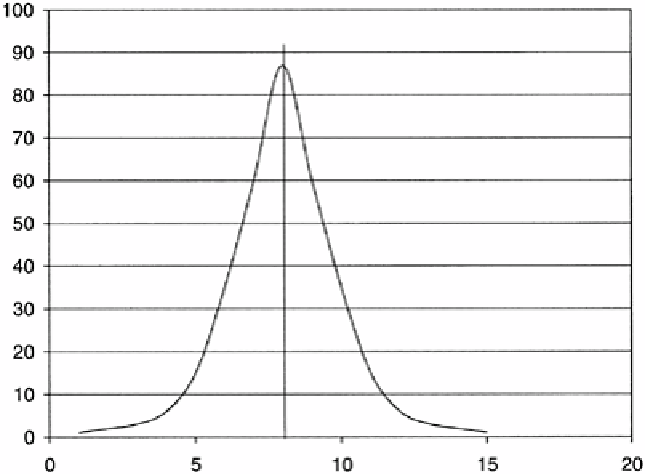
FIGURE 6.2
A bell-shaped curve. The line shows the median and the mean for
this set of data. (A true bell curve is calculated using the formula
).
to have this standard normal distribution characteristic. In all cases this assumes that a
large population is sampled; in most field sampling situations, however, neither a large
sample population nor a large number of samples is feasible for reasons of either time or
economics. Unless we know otherwise, the assumption is that the population is a normal
distribution and that the sample taken is representative of that normal distribution.
The shape of the curve will be significantly different for a population if the mean and
median are different. This will produce a bell curve that is not symmetrical (or it is
skewed). This would mean that on either side of the mean the curve would be different.
Such a situation is illustrated in Figure 6.3.
6.4.
HYPOTHESIS
One of the first steps in using statistics is to develop a hypothesis that is used in
interpreting the results of the statistical analysis. Typically the hypothesis is that two
populations or sets of data represent two different populations or are from the same
population. In field sampling we are often interested in using statistics to determine if an
analyte is above or below some cutoff level. Another way in which hypotheses are used is
to determine if two areas being sampled have the same or different levels of
contamination. Two

Search WWH ::

Custom Search