Environmental Engineering Reference
In-Depth Information
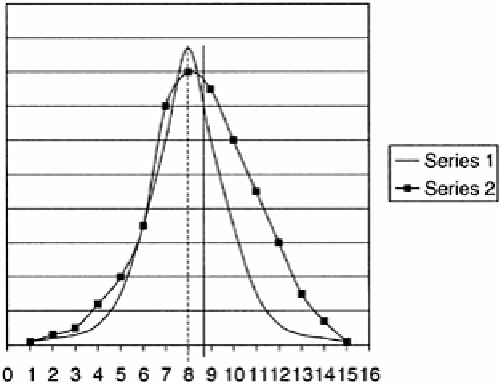
FIGURE 6.3
Graph showing a rightward-skewed distribution (series 2). The
dashed line is the median and the solid line the mean.
adjacent areas having the same level may be sampled as one unit rather than two, saving
time, effort, and money.
Examples of hypotheses are given in Table 6.4. The first two hypotheses state that the
population sample is equal to (in the first case) or not equal to (in the second case) the
sampled population, respectively. The second two equations state that the population is
larger than the sample population and smaller than the sample population, respectively.
Hypoth-eses are extremely valuable and powerful tools in any research. Whether or not a
hypothesis is correct is immaterial, because no matter which is the case, valuable
information about the samples and the populations being studied is obtained. Hypotheses
should never be looked at as being correct or incorrect.
Looking at the pHs in Table 6.3 we might have a hypothesis that the pHs are all from
the same population (i.e., all the samples are the same). This represents the first
hypothesis in Table 6.4 and is the one we will use to test whether or not the pHs are the
same. Another way to state this is that the method of determining the pH of soil does not
change the pH obtained. This hypothesis will be tested later in this chapter [2].
6.5.
MEDIAN AND MEAN
Two essential pieces of information about a set of data is to determine the central
tendency, which is the median or the mean, and the standard deviation. These numbers
form the basis for all other calculations. The median is found by arranging the data in
ascending or descending order. If the number of data points
n
is odd, the middle number
is the median. If the number is even, the median is the average of the middle two
numbers. There are other ways of calculating the central tendency, such as the average
Search WWH ::

Custom Search