Database Reference
In-Depth Information
Tactical decisions are the middleground between strategic and operational
decisions. For the most part, in the preceding example scenarios, the decisions
being taken into account and the data being monitored are known ahead of
time; tactical decisions are often about data exploration more than just pure
monitoring or evaluating a detail view. For instance, a product manager may
need to decide which products need to be held in extra stock over the fes-
tive season. The product manager examines the product's sales data and its
seasonality, and might also examine data from fashion labels that highlights
which products will have strong marketing campaigns. The key here is more
interactivity and flexibility than in the other views. Decisions and actions aris-
ing from tactical business intelligence (BI) typically sit between strategic and
operational in terms of both their business impact and the quantity of them.
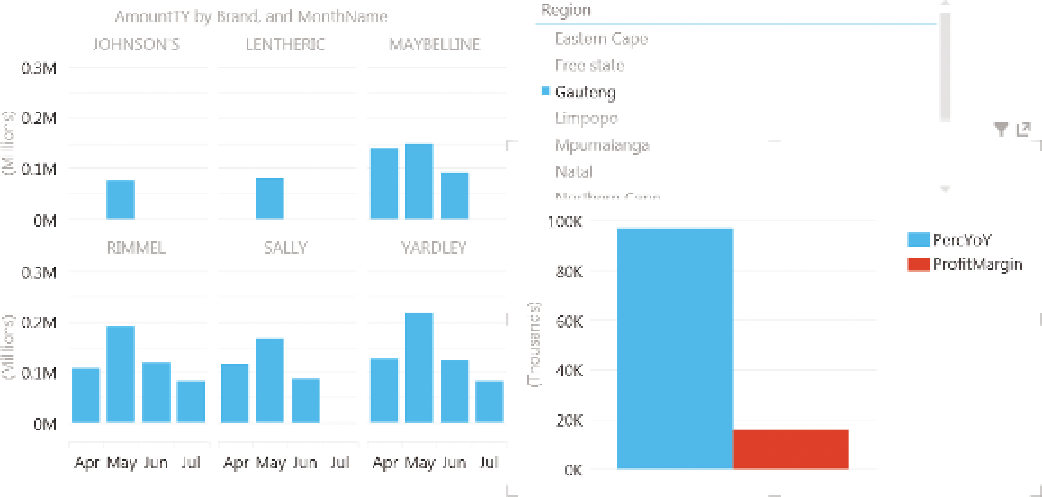
An example of a tactical report is shown in Figure 2-9. This report provides an
interactive view of sales and profit, broken down by month and by brand, and
with a slicer for region. The view allows for additional analysis by changing each
chart element according to the other chart elements that are clicked on—for
instance, when clicking a particular brand, each column for the months will
be split up by that brand. This is covered in more depth in Chapter 6.
The Microsoft business intelligence toolset loosely follows this model:
PerformancePoint dashboards match to the strategic level; Excel, PowerPivot,
and now Power View match to the data exploration of the tactical level; and
Reporting Services is often used for operational-level reports. This correlation
is not very strong and is explored further in Chapter 3.
FIguRe 2-9
An example of a tactical report being used for data exploration. Clicking on one chart or slicer will filter the other charts.

